Target Hospitality Corp (TH)., founded in 1978, is headquartered in The Woodlands, Texas. It operates the largest vertically integrated specialty rental and value-added hospitality services company in the United States. Target builds, owns, and operates a network of communities for various end users and offers catering and food, concierge, laundry, maintenance, groundskeeping, logistics, security and health and recreation services. The company focuses on building, owning, and operating housing communities including oil, gas, energy, infrastructure, and government. Moreover, it has a network of specialty rental accommodations with approximately 16,000 beds across 31 communities. The company’s focus is on the core values of safety, care, excellence, integrity, and collaboration. Its care for its vulnerable populations provides interactive educational services, premier recreational facilities and comprehensive medical treatment capabilities.
TH recorded quarterly revenue of $159.6 million for the three months ended September 30, 2022, an increase of 79% from the same period in 2021. Moreover, it had a 30% CAGR since 2020 with 2022 revenue $498 million in. Over the past 12 months, its sales growth has been a superior 79%. Currently, TH does not pay a dividend. Its average daily trading volume of 763,267 shares provides reasonable liquidity to traders and investors alike.
The stock price hit an all-time high on Thursday, January 12, 2023, and backed off a bit on Friday. The 4-year chart shows a period of price consolidation between May 2020 and March 2022. Then, just before the 2nd quarter earnings release in early August, the stock price and volume accelerated to the upside with the price advancing from $7.61 to the current $17.93, a jump of 136%. This same situation occurred with its positive 3rd quarter earnings release on November 7. Note the increased average share volume since March 2022 where the volume has more than tripled from a year earlier. This is a positive sign of significant retail, institutional and mutual fund interest. Moreover, TH is ranked first out in the Real Estate Management Industry and Business Sectors, quite an accomplishment.
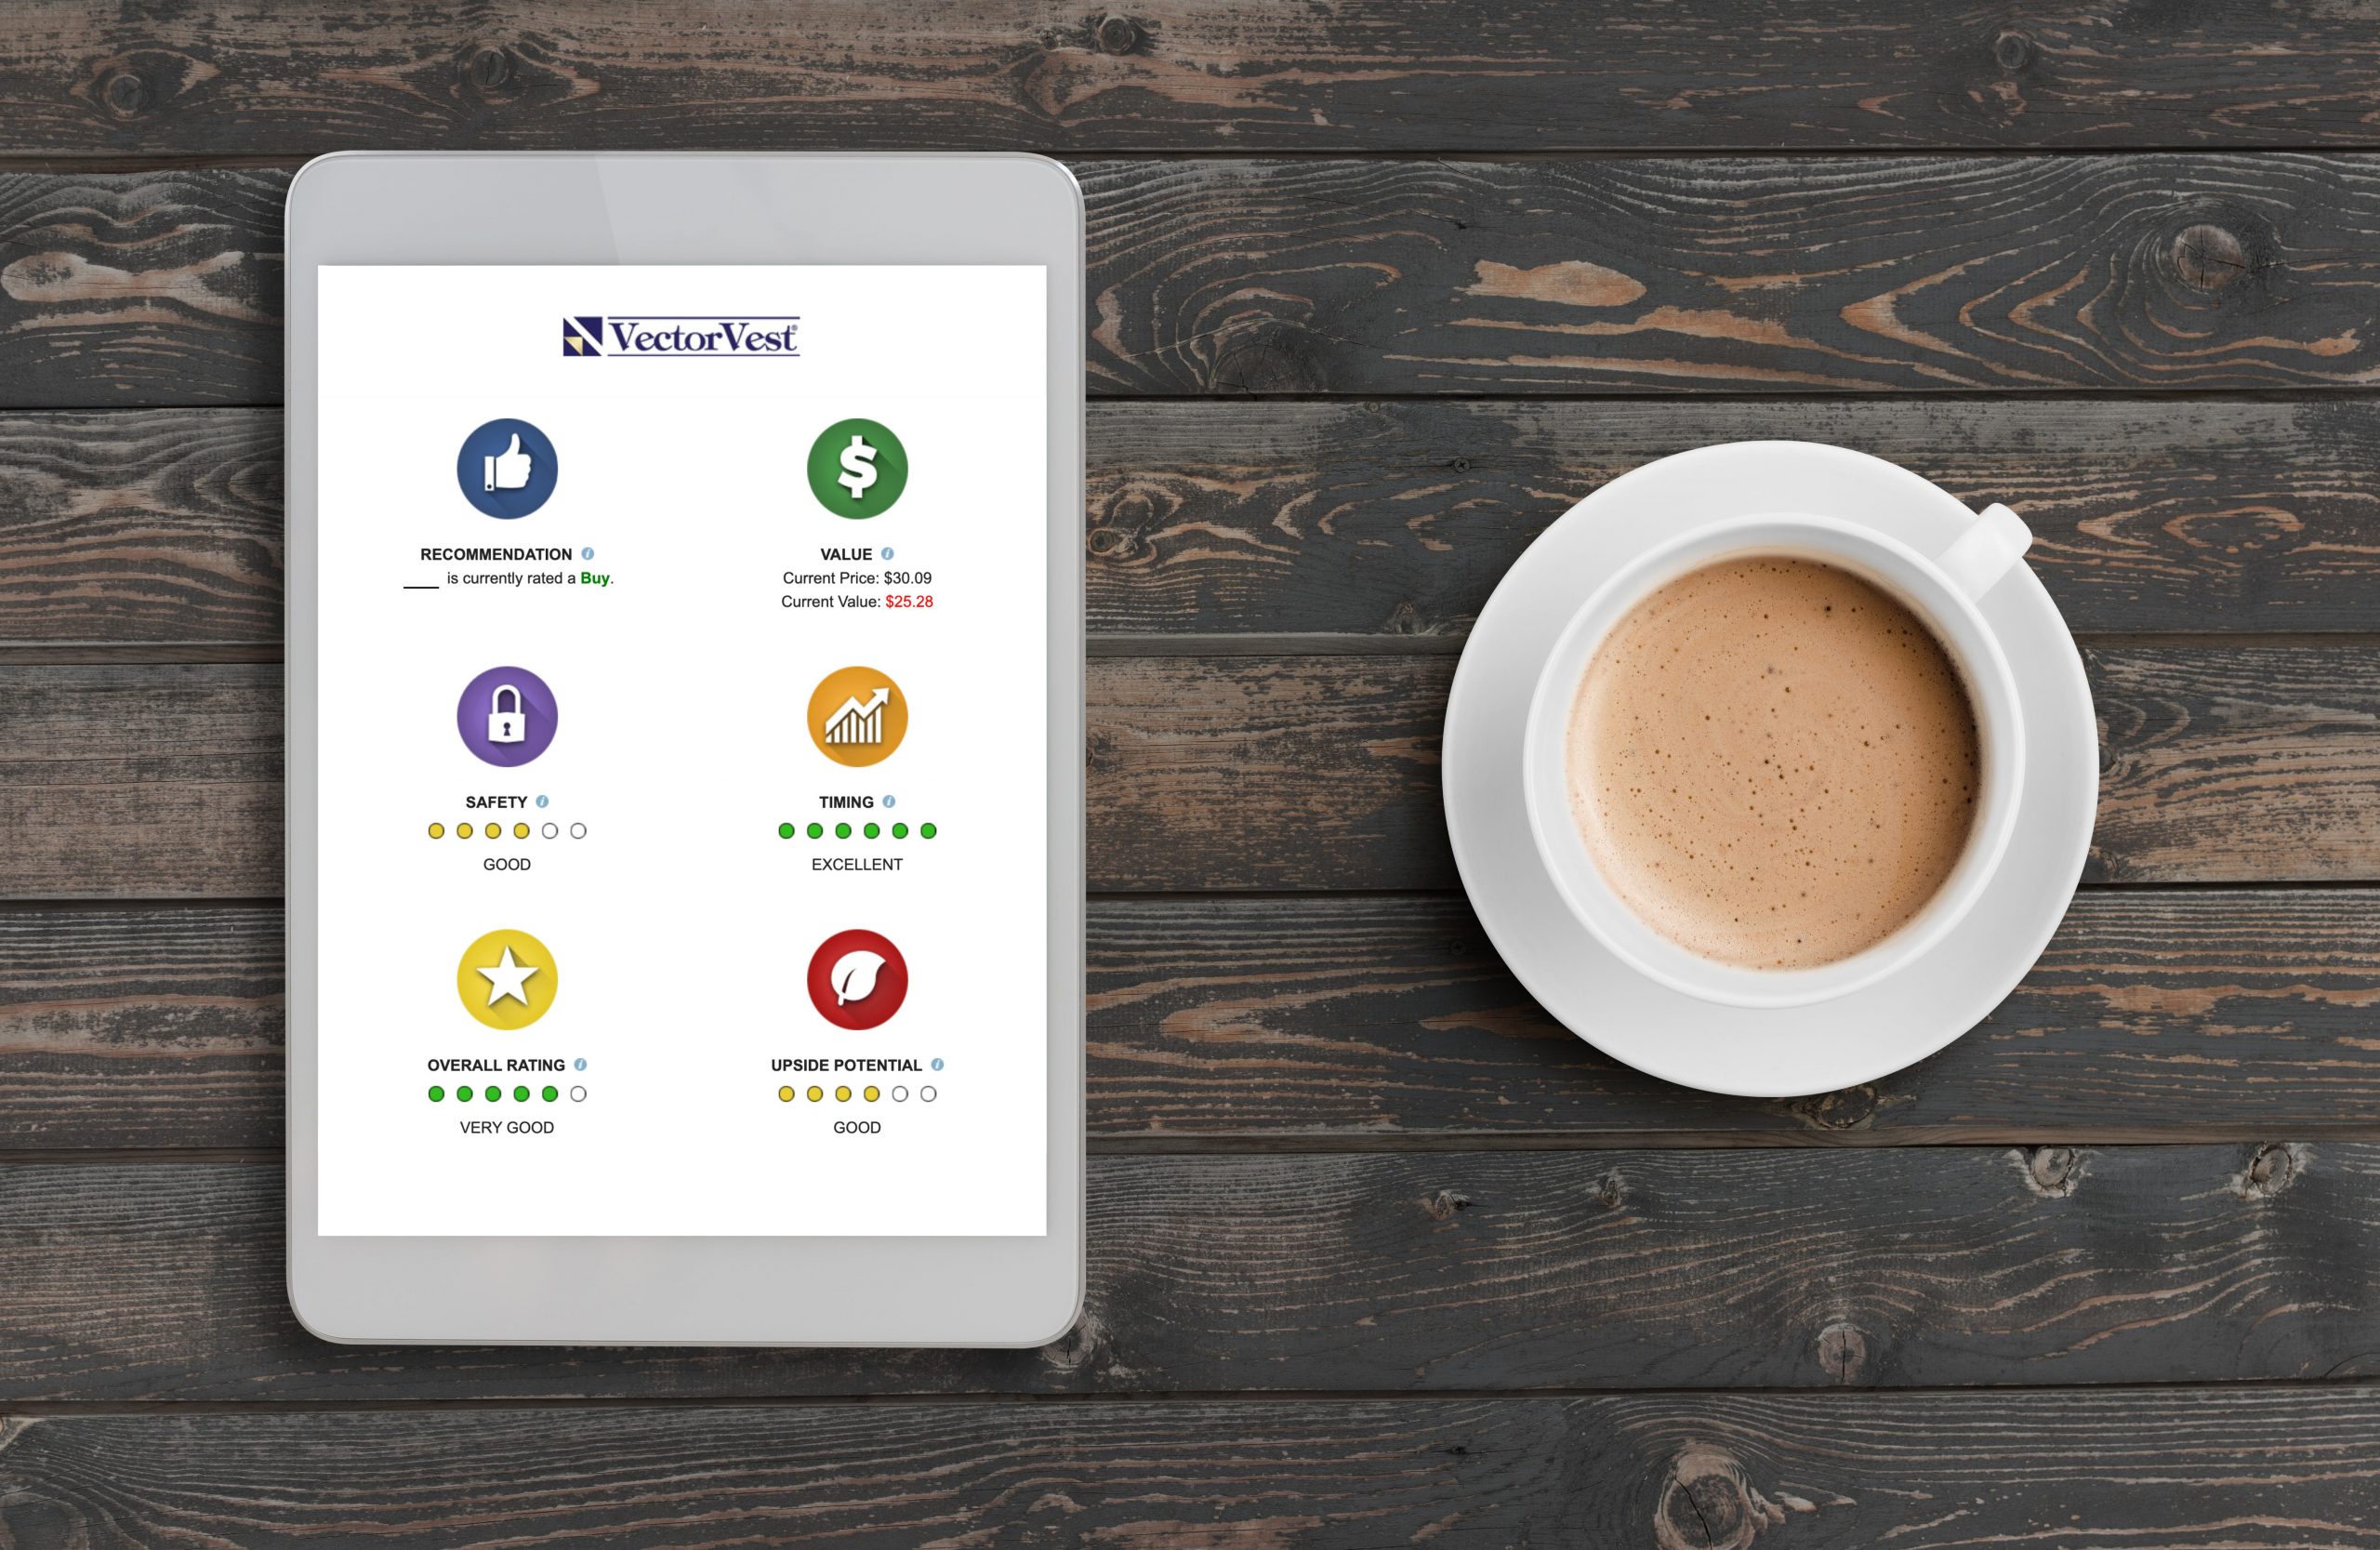
The VectorVest ratings of TH are as follows:
- Excellent Upside Potential: The Relative Value (RV) rating focuses on a stock’s long-term, three-year price appreciation potential. The current RV rating for TH is 1.65 – well above the 1.00 level on a scale of 0.00-2.00. VectorVest’s current value of the stock is $25.16 compared to its current price of $17.65 therefore it is considered very much undervalued.
- Fair Safety: The Relative Safety (RS) rating is based on the company’s business longevity, financial predictability/consistency, debt-to-equity ratio, and additional risk parameters, including price volatility. The RS rating of 0.86 is marginally below average, indicating more than average risk.
- Excellent Timing: The Relative Timing (RT) rating focuses on the price trend over the short, medium, and long term. The components include price direction, dynamics, and price magnitude of price changes over daily, weekly, quarterly, and yearly comparisons. TH has an exceedingly high RT rating of 1.71 As the accompanying chart shows, TH closed on Friday just below its all-time high, and it is comfortably above its 40-day moving average.
- Excellent Comfort Index: This index measures the consistency of a stock’s long-term resistance to severe and lengthy corrections. This index compares the individual stock to the fluctuation of the VectorVest Composite price that is measured on a scale of 0 to 2.00. At a level of 1.76, clearly, TH has an exceedingly higher-than-average rating. This high rating is a comforting factor to conservative investors.
- Very Good Earnings Growth Rate (GRT): TH’s 50% forecasted growth rate is well above average and is measured over a forecasted three-year period. This fundamental factor is calculated in the VectorVest software so you don’t have to do the work. Its 4-year chart highlights the up-trending earnings since July 2022, with forecasted earnings per share of $1.80 with a low P/E ratio of 9.67.
- Very Good VST Score: The VST Master Indicator ranks nearly 9,200 stocks from high to low and brings to the top of the rankings those stocks with the highest VST scores. TH score is 1.46 which is better than most stocks’ score in this recovering bear market. Using VST enables users to determine stocks that are acting better than average, as well as the opportunity to find the cream of the crop with a few mouse clicks.
Considering all the VectorVest rating criteria, is this a good time to buy TH, as it is right at its all-time high, or is it about to consolidate before its next move? Check out VectorVest’s rating. To see the TH rating you can analyze TH free using VectorVest to get the recommendation.
Want These Types of Insights at Your Fingertips so You Can Win More Trades?
Use VectorVest to Analyze any stock free. VectorVest is the only stock analysis tool and portfolio management system that analyzes, ranks and graphs over 18,000 stocks each day for value, safety, and timing and gives a clear buy, sell or hold rating on every stock, every day.
Before you invest, check VectorVest! Click here to ANALYZE ANY STOCK FREE and see our system in action!
What you should do next…
- Get our latest blogs delivered right to your inbox, subscribe to our newsletter.
- The market moves fast! Get our most current evaluation of this stock with our FREE stock analysis tool.
- Looking for stock picks? Not sure if now is the right time to buy/sell? For a limited time, enjoy the full benefits of a 30-day subscription to VectorVest for only $0.99 (usually up to $148/month) . Get access to our full list of screeners showcasing our top stock picks that tell you exactly what to buy, when to buy, and when to sell.


Leave A Comment