
There are many different forms of analysis you can use to analyze stocks, from technical vs fundamental analysis. We’ve covered all the best indicators for swing trading in a separate blog post. But, what is the best time frame for swing trading?
- Daily Swing Trading Chart: Shows short- to mid-term price trends and momentum shifts to help you spot entry points and gauge short-term sentiment.
- Weekly Swing Trading Chart: Reveals the broader trend and key support/resistance zones so you can confirm you’re trading in the right direction.
- 4-Hour Swing Trading Chart: Offers more precision for timing entries and exits within the daily setup to help you refine trade execution.
Looking at the different chart time frames gives you more insights than if you were to only look at a single time frame. You wouldn’t get the full picture. But the last thing you want to do is get stuck in analysis paralysis, looking at different charts all day instead of actually taking action and executing trades.
We’re going to break down the different chart time frames you can leverage in your analysis and explain which are best so you can use your time and resources wisely. But, we’ll also introduce a simple way to analyze stocks and win more trades – the #1 Motley Fool alternative and Seeking Alpha alternative, VectorVest.
Table of Contents
- What is Swing Trading?
- Charts, Time Frames, & Swing Trading
- Why Using the Best Time Frames for Swing Trading is So Important
- What is the Best Time Frame for Swing Trading?
- Why Limit Yourself to a Swing Trading Time Frame?
- Common Mistakes
- Simplify Investing with VectorVest!
- Frequently Asked Questions
Featured Courses:
What is Swing Trading?
This investment style involves holding a stock for as little as few a days to a few weeks at most. The goal is to capitalize on short- to medium-term price movements.
You’re not in and out in minutes like a day trader, but you’re also not sitting on positions for months like a long-term investor. You’re looking for well-timed entries and exits based on patterns, momentum, and technical indicators.
The appeal is obvious – you can benefit from market moves without being glued to your screen all day. It’s flexible, it can be done part-time, and with the right strategy, it can be consistently profitable.
But, success depends on how (and more importantly, when) you analyze the charts. That’s why understanding the best swing trading time frame is so important.
A Quick Explanation of Charts, Time Frames, & Swing Trading
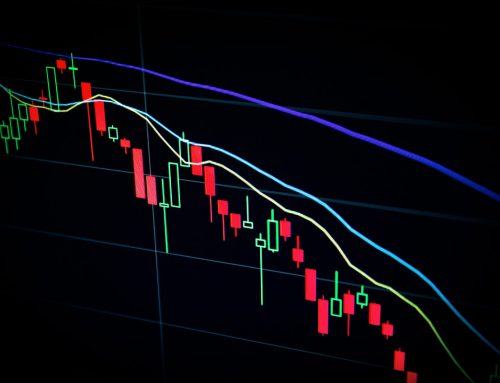
There are two types of charts you can use when swing trading: candlestick charts and bar charts. Candlestick charts give you more insights because they show the opening, closing, high, and low prices for a stock. Bar charts only show the closing price.
Time frames are how long each candlestick or bar on your chart represents. For example, if you’re looking at a daily chart, each candlestick would represent one day of trading action. If you’re looking at a weekly chart, each candlestick would represent one week of trading action. There are also monthly and yearly time frames.
Why Using the Best Time Frames for Swing Trading is So Important
The best time frames for swing trading dictate your success rate as a trader. They allow you to make more informed decisions. If you’re looking at a monthly chart and trying to make trade decisions based on that, you’re not going to be as successful as someone who’s looking at a daily or weekly chart. Why? Because you’re too zoomed out to see what matters more to swing traders!
The best time frames for swing trading give you the most relevant information possible so you can make the best decisions possible. This doesn’t mean you should only look at a single time frame chart, but rather use multiple time frames in your analysis. So, what is the best time frame for swing trading?
What is the Best Time Frame for Swing Trading?
There’s no single time frame that works for everyone. Your goals, schedule, and trading strategy will all influence which chart view makes the most sense. That said, there is one time frame that tends to be the most effective for most swing traders – and that’s the daily chart.
Daily Swing Trading Chart
The daily chart shows one candlestick per trading day. Each candle captures a full day of price action – open, high, low, and close. This gives you a balanced look at momentum, patterns, and trend strength without too much noise.
Pros:
- Clean overview of price trends and support/resistance
- Ideal for spotting common swing setups like breakouts and pullbacks
- Balances detail with perspective – no info overload
Cons:
- May lag on fast-moving stocks
- Doesn’t always show early signs of reversals
Weekly Swing Trading Chart
The weekly chart condenses each candlestick into one full week of trading. It’s a zoomed-out perspective that’s great for identifying macro trends and spotting higher-level support and resistance. Some swing traders use this as a confirmation tool to support their main setup chart.
Pros:
- Helps confirm longer-term trend direction
- Filters out noise and false signals from daily volatility
- Useful for aligning trades with broader market cycles
Cons:
- Too slow for precise entry and exit timing
- Can miss shorter-term opportunities entirely
4-Hour Swing Trading Chart
On the other end of the spectrum, the 4-hour chart shows a new candlestick every 4 hours. It’s an intraday time frame that still offers some trend clarity. While it’s not always necessary, it can be a helpful supplement to the daily chart when you’re looking to fine-tune entries or exits.
Pros:
- Useful for zooming in on entry/exit points
- Can reveal early shifts in momentum not yet visible on daily
- Good for traders who like more control over execution
Cons:
- More screen time and monitoring required
- Increased risk of analysis paralysis from over-interpreting short-term moves
Why Limit Yourself to a Swing Trading Time Frame?
Each swing trading time frame has its place – which is why the best swing trading strategy is to rely on one, but utilize others. Using multiple time frames can give you a much clearer picture of what’s happening in a stock.
For instance, you can use the daily chart to spot your setup – maybe a bullish flag or a clean breakout pattern. But then you can drop down to the 4-hour or even the 1-hour chart to dial in your entry and set a tighter stop. And if you want to confirm the overall trend, check the weekly to make sure you’re not trading against the tide.
Multi-time frame approach helps you trade with more confidence. You avoid getting faked out by noise on the lower time frames, and you also avoid missing big signals that only show up on the higher ones.
Think of it like zooming in and out with a camera – you want to see both the landscape and the details before you take the shot. Same idea here.
Common Mistakes We See Investors Make When Choosing a Time Frame for Swing Trading
Understanding how to use swing trading time frames is one thing – but knowing what not to do when using the best time frame for swing trading is just as important.
Following the Noise
One of the biggest mistakes new swing traders make is picking a time frame just because they saw someone else using it.
You’ve probably seen this before: someone on Reddit or YouTube swears by the 15-minute chart for swing trading. So naturally, you try it – only to get whipsawed to death. What works for someone scalping options isn’t going to work for you if you’re holding shares for a week or two.
Chart Hopping
We also see investors constantly switch between time frames without a clear reason. One minute you’re on the daily chart, the next you’re checking the 30-minute, and suddenly you’re convinced your setup’s gone bad.
This is called chart hopping, and it creates information overwhelm and leads to overtrading. You end up chasing entries, second-guessing exits, and trading emotionally instead of following a plan.
Relying Too Heavily on Short Time Frames
Don’t get us wrong, the 4-hour time frame has its place in swing trading. But, thinking that more data means more control is another common mistake we see investors make. In reality, it just adds more noise.
The more you stare at 5-minute candles, the easier it is to mistake randomness for a pattern. This can lead to premature entries, unnecessary exits, and missed opportunities on the bigger trend.
Thinking Traditional Technical Analysis is the End-all, Be-all
But maybe the biggest mistake? Thinking that staring at charts all day is what gives you the edge. It’s not. You don’t need to live inside your trading platform to win more trades. You can actually work smarter instead of harder. That’s where VectorVest comes in.
Simplify Investing with VectorVest – No Matter Which Chart Time Frame You Prefer!
There’s no doubt that swing trading can be profitable, but it’s not for everyone. It takes dedication, discipline, and most importantly – the right resources. We’ve got great resources to help you learn how to swing trade – such as our in-depth blog posts on how swing trading works, swing trading strategies, when to sell swing trading stocks, and more.
But at a certain point, you need to take action and start investing – even if you start swing trading with a small account. To really set yourself up for success, you need to invest in the right tools – like a stock forecasting software. This is where VectorVest comes in.
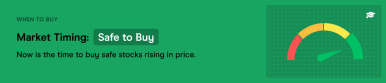
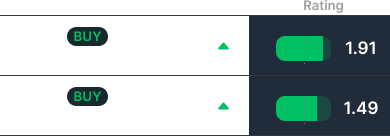
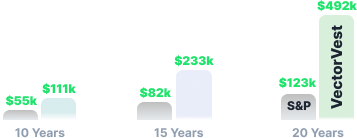
Our tools help investors simplify fundamental and technical analysis into three simple, easy-to-understand ratings: relative value (RV), relative safety (RS), and relative timing (RT). These make up the overall VST rating a stock is given – and from there, we’re able to give you a clear buy, sell, or hold rating. This helps you win more trades, keeping your losses small and infrequent. You can use all the different time frame charts in our software – but frankly, the analysis we do for you is more than enough to help you uncover opportunities and execute your trades to perfection. To see the system in action, get a free stock analysis today.
Parting Thoughts on the Best Time Frames for Swing Trading
Now that you know what time frames to use for swing trading, you’re ready to start using multiple time frame analyses in your investment strategy. There’s no one-size-fits-all answer to the best time frames for swing trading – however, we typically encourage traders to rely on daily or weekly charts when swing trading stocks. Using intraday time frames can be overwhelming – and frankly, doesn’t provide you with the insights you need as a swing trader. On the other hand, monthly or annual time frames are zoomed out too far – and won’t help you identify your window of opportunity.
Remember – you’re not concerned with the minute-by-minute changes in a stock’s price like a day trader may be. And, you’re not concerned with a stock’s price over the course of a month or a year. You’re looking for opportunities to buy low and sell high – over the course of just a few days – or a week or two at most.
There is no better investment than in yourself – which is why setting yourself up with the right tools is the best way to enjoy a high rate of success as a swing trader. Take a look at our desktop software or our mobile stock advisory and experience effortless, emotionless investing. You’ll never go back to traditional analysis!
Frequently asked questions
Which time frame chart is best for swing trading?
The daily chart is the most common time frame for swing trading. You get a clear picture of short-term trends without too much noise.
Are the recommendations different for beginners?
Nope. Stick to the daily chart if you’re just starting as it strikes a balance between signal clarity and manageable pace.
What time frame do most traders use?
Most swing traders use the daily chart, supported by weekly for trend context and 4-hour for fine-tuning entries.
Can I use the 4-hour chart for swing trading?
Yes, but it shouldn’t replace your higher-level view. It’s great for dialing in your entries and exits.
Should I use more than one swing trading time frame?
Absolutely! Multi-timeframe analysis helps you align with the bigger trend while finding tactical entry points.
How profitable is swing trading?
Very – IF you follow a consistent system, manage risk, and avoid emotional decisions. VectorVest can help you win more trades with less work and stress.
How do I tailor the time frame when swing trading in volatile markets?
Zoom out using daily and weekly charts to reduce noise and avoid getting whipsawed by short-term price swings.
Should I regularly review and reframe my swing trading time frames?
Definitely. Your strategy should evolve with market conditions, your schedule, and your level of experience.
How do I pick stocks for swing trading?
You can do things the old-fashioned way with technical analysis, OR, you can use our Morningstar alternative / TradingView alternative: VectorVest. It saves you from constantly stressing about the best time frame for swing trading by telling you clearly what to buy, when to buy it, and when to sell it. Try it today!
Featured Courses:
What you should do next…
- Get our latest blogs delivered right to your inbox, subscribe to our newsletter.
- The market moves fast! Get our most current evaluation of this stock with our FREE stock analysis tool.
- Looking for stock picks? Not sure if now is the right time to buy/sell? For a limited time, enjoy the full benefits of a 30-day subscription to VectorVest for only [offer_txt] (usually up to [saving_txt]/month) . Get access to our full list of screeners showcasing our top stock picks that tell you exactly what to buy, when to buy, and when to sell.


