A data-driven week means it’s time for a refresher on what could be the biggest market mover for February, also known as PCE data. The PCE (Personal Consumer Expenditures) is the Fed’s preferred inflation measurement because it gives a peak into consumers’ saving and spending habits. Wednesday, February 28th, the preliminary Core PCE was released, but let’s explore the potential impact of the February 29th official PCE data.
The BEA (Bureau of Economic Analysis) reports the PCE data, providing a snapshot of the US’s financial health. Consumer spending is the life of the U.S. economy, and economists and analysts take the PCE data, which demonstrates consumer spending, and use it to predict future spending and economic growth. Businesses will analyze the PCE data to decide what products and services are doing well, influencing their hiring and investing decisions. The Fed also loves to use this metric as a key indicator of the progress in inflation. It is an indicator of what has occurred in the economy and what could continue happening in the markets due to the historical reaction of businesses and the Fed.
What you need to know!
Understanding data, where it comes from, and why it’s important is initially overwhelming. So here’s what you need to know: the BEA tracks the personal consumption expenditures price index or PCE price index. The price index is a focused metric assessing the fluctuating prices of goods and services bought by U.S. consumers. This index parallels the Bureau of Labor Statistics consumer price index for urban consumers; however, they’re different in their construction and the inflation rates they report.
The PCE price index is known for appropriately mirroring inflation (or deflation) while adapting to shifts in consumer habits. For instance, if there was a hike in the price of eggs, it might lead consumers to purchase fewer eggs, a behavior that would be tracked. Another aspect of this measurement is the core PCE price index, which excludes food and energy prices because of their volatility.
The Federal Reserve prefers PCE data over metrics like CPI data for several reasons. This preference started after in-depth analysis and comparisons were held around the year 2000, following which the Federal Open Market Committee (FOMC) shifted its focus from CPI to PCE inflation around the year 2000.
- Expenditure Weights: PCE allows for flexible adjustments in expenditure weights, reflecting changes in consumer behavior as they shift preferences among goods and services, which captures the evolving consumption patterns of households more accurately.
- Comprehensive Coverage: PCE encompasses a more comprehensive range of goods and services than CPI, offering a more holistic view of consumer spending behaviors.
- Historical Revisions: PCE data permits historical revisions beyond seasonal adjustments, which only contributes to the accuracy and reliability of the inflation measure.
The Fed’s use of PCE data only solidifies the value of what could move the markets coming up tomorrow.
How to prepare for the data!
As data unfolds, caution remains paramount. The recent market rally, fueled by Nvidia's strong quarter, suggests a potential pullback in high-flying names, especially those tethered to the AI trend. Berkshire Hathaway's cautious stance, with a reported cash reserve of $167.7 billion, adds to the air of prudence. Warren Buffett's warnings hint at potential movements in larger-cap companies. The PCE data's impact on these unfolding events could be significant, influencing market sentiments.
Investors are advised to stay vigilant about potential corrections in high-flying AI-related stocks and consider the implications of Berkshire Hathaway's caution on larger-cap companies. Keep a close eye on details, especially regarding companies claiming AI involvement, as the PCE data may directly impact these scenarios.
Use VectorVest!
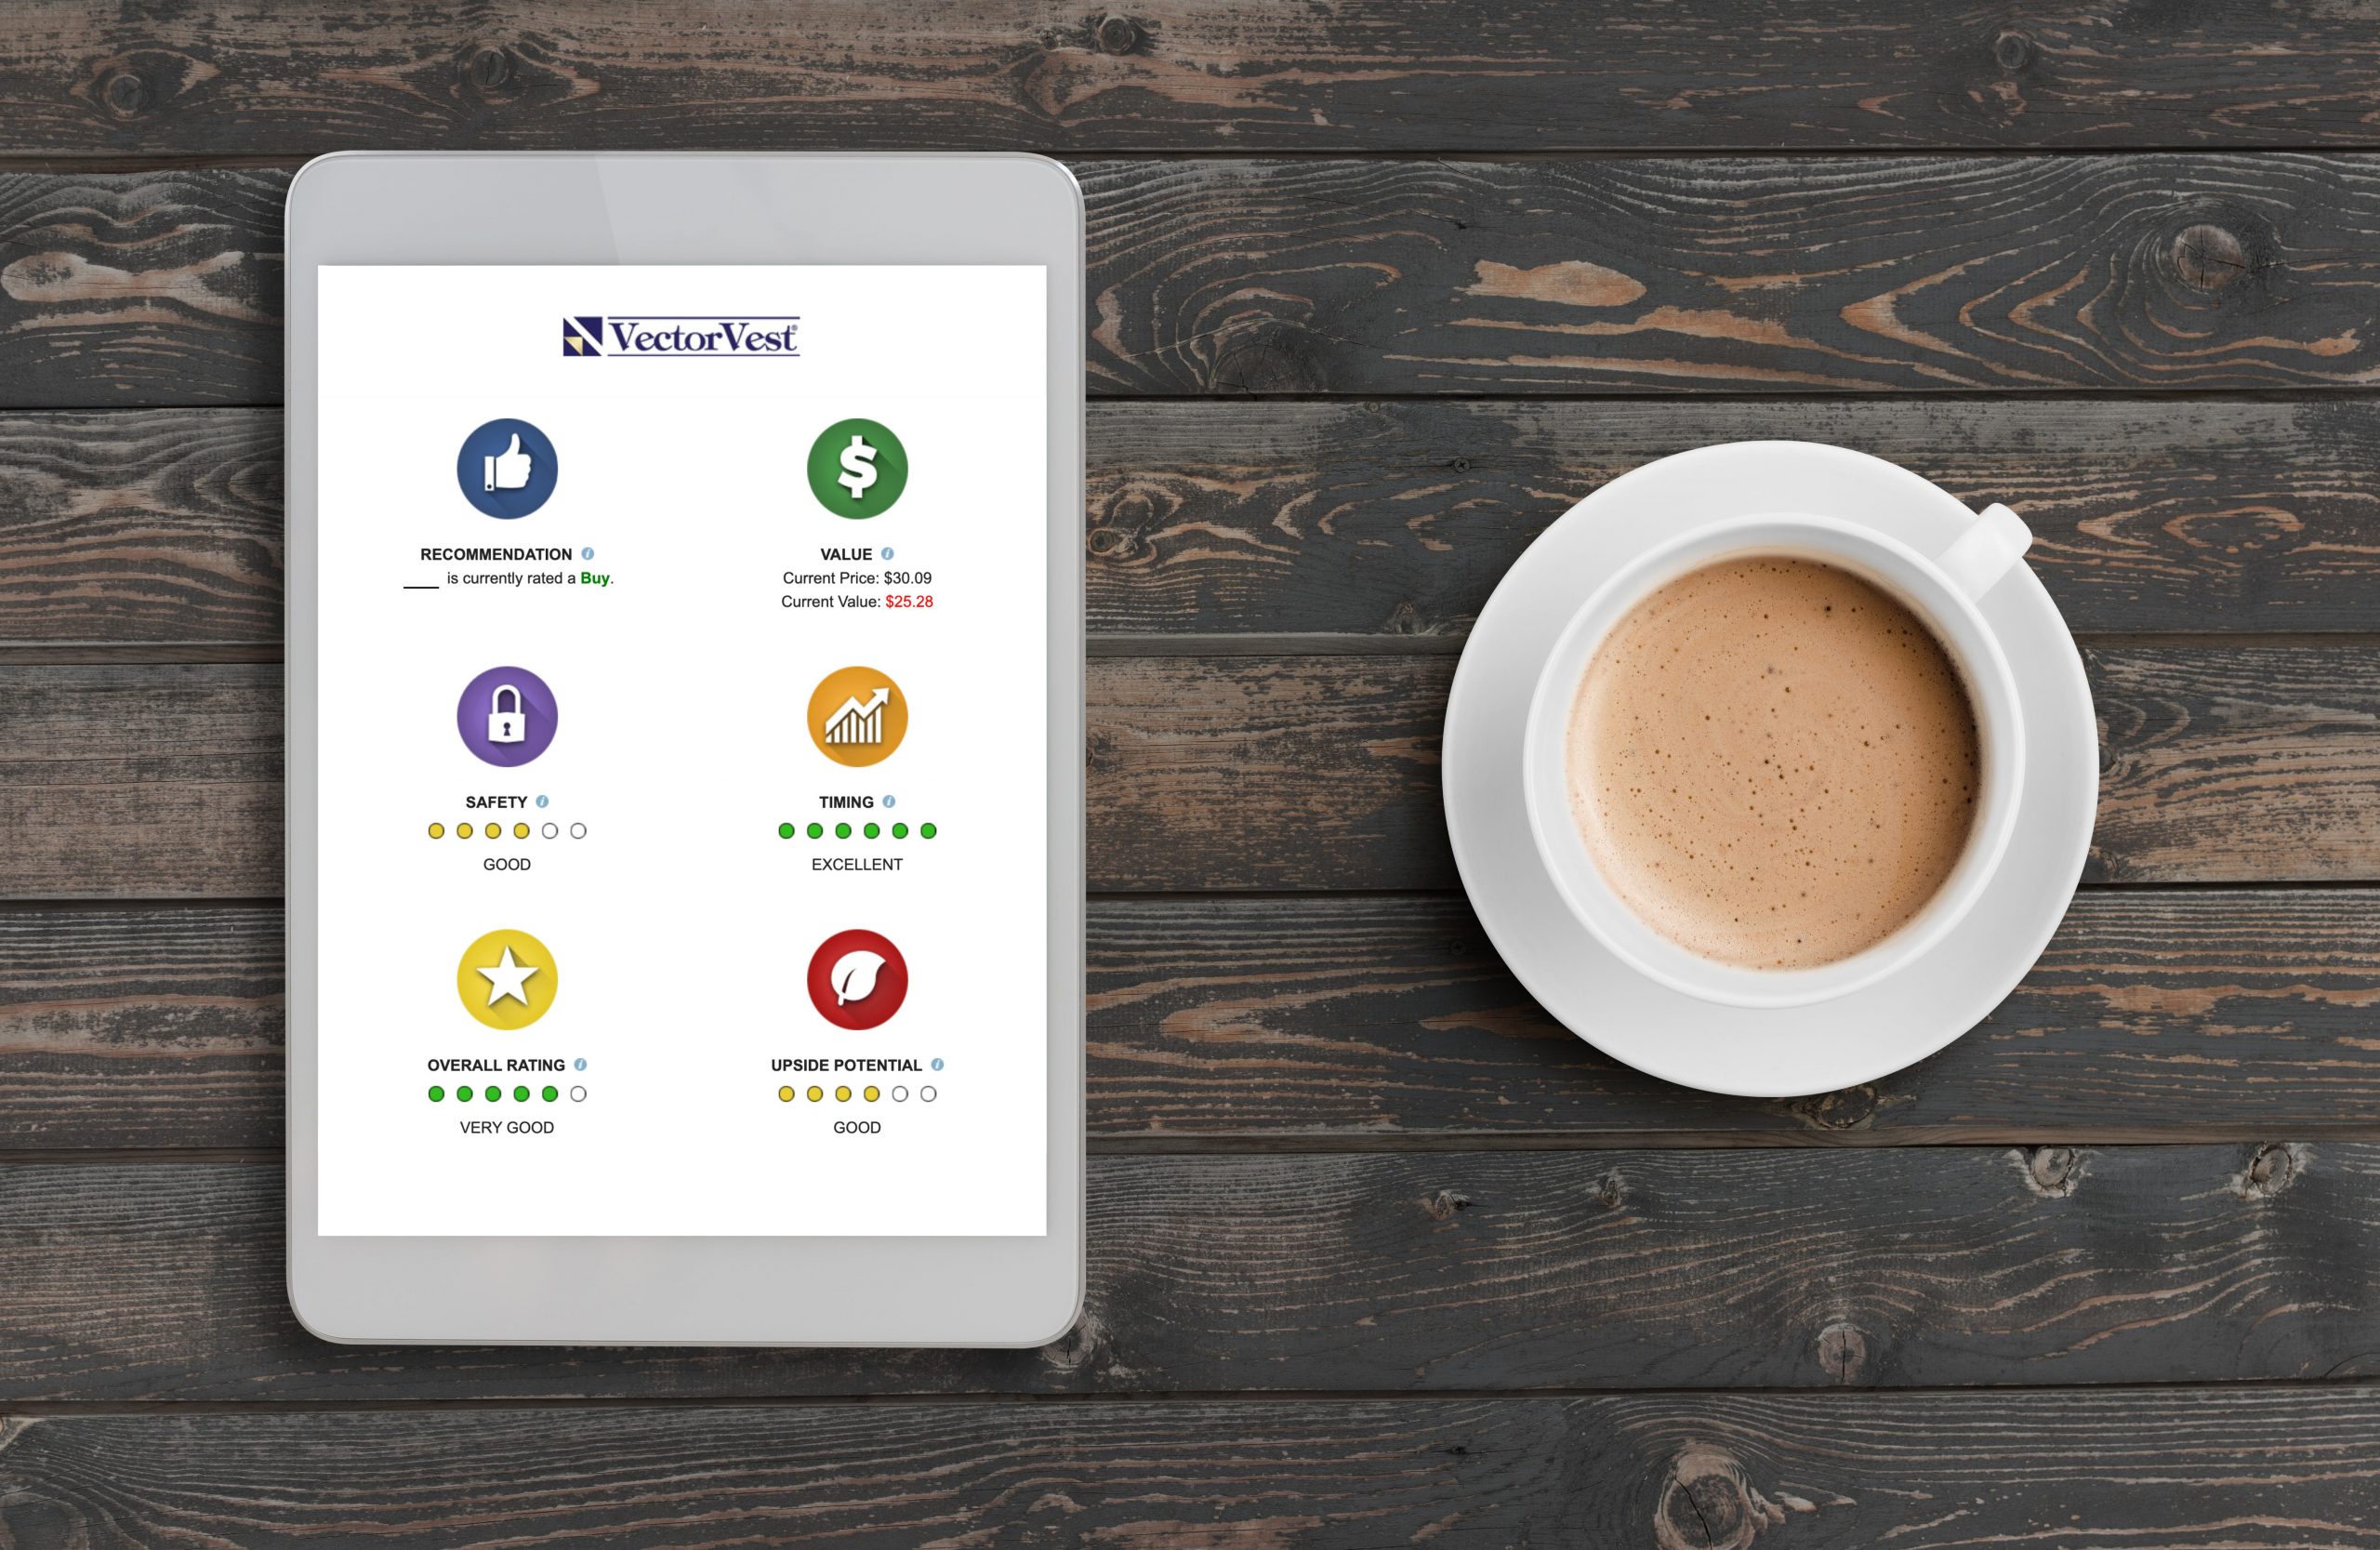
Considering the uncertainties surrounding Personal Consumption Expenditure (PCE) data, staying informed about individual stocks with Buffet remaining cautious and Nvidia copycats everywhere becomes challenging. VectorVest offers a solution in this complex landscape by efficiently handling metrics, providing precise insights, and offering data-driven recommendations.
VectorVest becomes a crucial tool for investors during a period of recalibration and uncertainty. By offering data-driven recommendations on potential investments and strategic timing, VectorVest helps investors navigate through the uncertainties associated with economic growth or downturns, ensuring a more informed and stress-free investment approach.
Before you invest, check VectorVest! Click here to ANALYZE ANY STOCK FREE and see our system in action!
What you should do next…
- Get our latest blogs delivered right to your inbox, subscribe to our newsletter.
- The market moves fast! Get our most current evaluation of this stock with our FREE stock analysis tool.
- Looking for stock picks? Not sure if now is the right time to buy/sell? For a limited time, enjoy the full benefits of a 30-day subscription to VectorVest for only $0.99 (usually up to $148/month) . Get access to our full list of screeners showcasing our top stock picks that tell you exactly what to buy, when to buy, and when to sell.


Leave A Comment