The beginning of quarter 2 feels like April Fools keeps going with the markets under pressure due to the Fed’s hesitancy to cut rates, global strife continuing, and Tesla’s (TSLA) poor deliveries dragging the market down. Although delayed rate cuts are disappointing, seeing one of the magnificent 7 continue to plummet hurts like more bad news on top of continued bad news. Tesla’s shares have fallen 33% so far in 2024 and continue to plummet due to poor delivery and production results; let’s dive into how the market’s responding, what’s causing the issues, and if Tesla is a buy.
Monday’s market closed with the Dow down 240 basis points (-0.60%), the S&P 500 down 11 basis points (-0.2%), and decliners doubling the number of advancers. A major contributor to the negative start was analysts already estimating poor numbers from Tesla’s Q1 report.
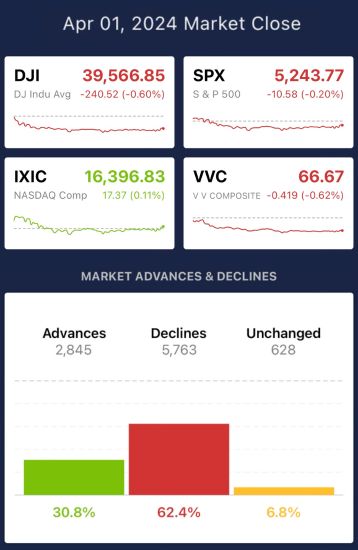
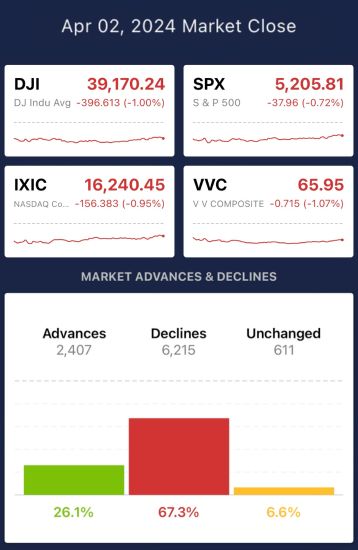
Tuesday’s market close showed even more pressure on the market, with the Dow down 396 points (-1.0%), the S&P 500 down 37 basis points (-0.72), and decliners making more gains over advancers. Tuesday was also the day Tesla reported those horrific numbers.
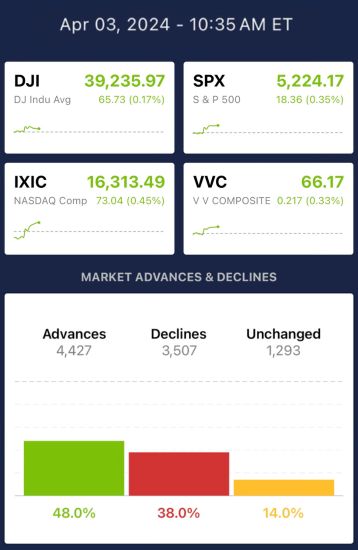
An hour into the trading session on Wednesday, stocks began to rebound due to the positive ISM data, with the Dow up 65 basis points (+0.17%), the S&P 500 up 18 basis points (+0.35%), and advancers taking the lead against decliners. However, despite the positive movement, quarter 2’s start remains negative due to the prior significant decline.
What’s going on at Tesla?
Tesla (TSLA) deliveries and production for the first quarter were down, indicating turbulent times for the company. In Q1, the company reported 386K deliveries, down significantly from the prior quarter’s report of 484K and the year ago’s quarter of 422K. Production was also down to 433K vehicles compared to the estimates of 450K. One might assume that all car manufacturers are struggling, but with Ford’s Q1 report coming out today with sales in the US up +6.8% year over year, and more especially EV sales up +86.1%, it’s hard to back up that assumption.
Following TSLA’s report, the stock dipped 5.2% Tuesday. The company explained the poor report as early phases of production ramp-up for the updated Model 3, and shutdowns related to the Red Sea shipping diversions are causing the disappointing numbers. Unfortunately for Tesla, the problem is more than just this isolated quarter. With issues spreading across factories in Germany, disgruntled workers, issues with updating vehicles, a challenging macro environment, and more. Tesla’s problems continue to grow, but it’s still in the magnificent 7, so is it still a buy?
What should you do with Tesla stock?
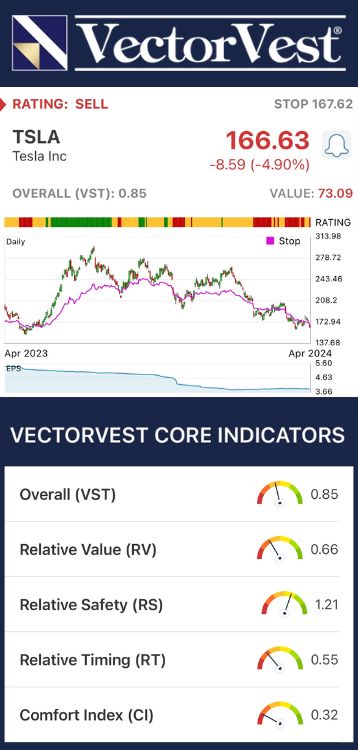
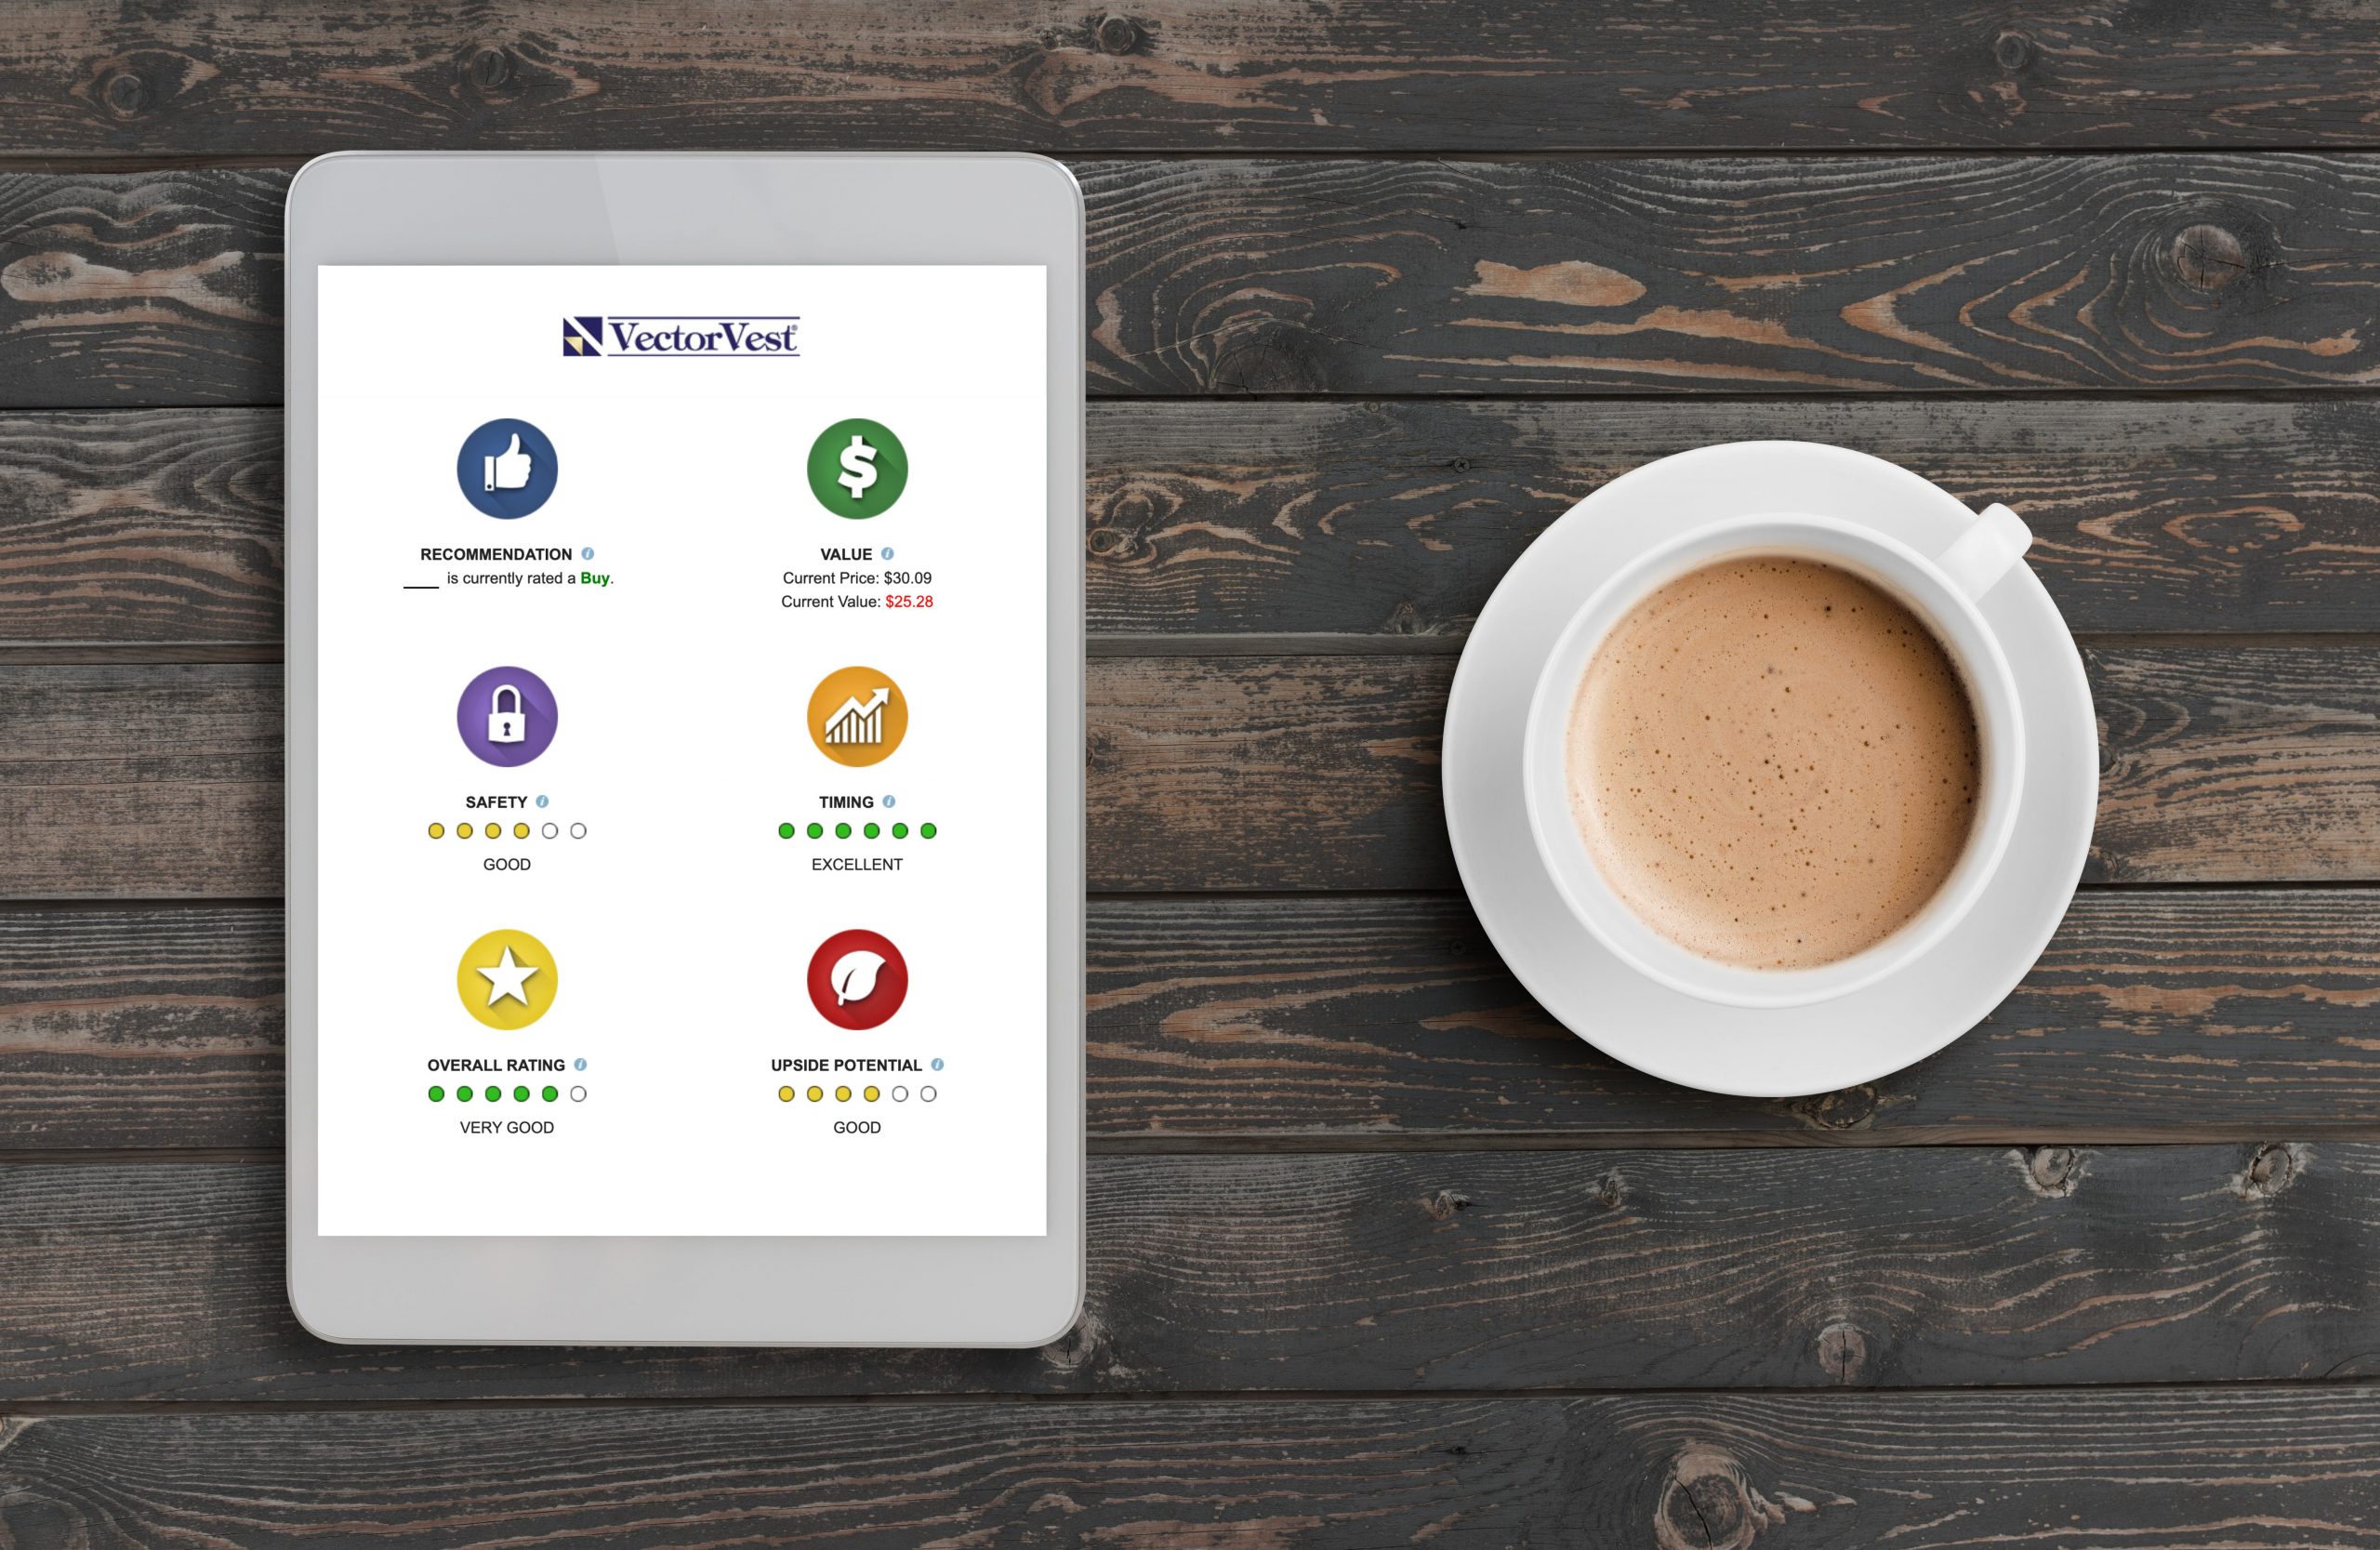
Investors can be biased when they hear about mega stocks and their performance (especially the magnificent 7), but just because a company has significant success doesn’t mean you should buy it. A legitimate financial analysis considers several components, not only a reputable name. VectorVest software generates three summary ratings: relative value (RV), relative safety (RS), and relative timing (RT), each scored from 0.00 to 2.00, with 1.00 representing the average; then the overall VST (Value-Safety-Timing) rating provides a decisive buy, sell, or hold suggestion for a specific stock. VectorVest’s three summary and overall ratings evaluated TSLA and concluded with a SELL recommendation.
- Upside Potential: The Relative Value score for TSLA is 0.66, far below average on a scale of 0.00 to 2.00, making it poor. It is overvalued, with a current price of $166.63 but a value of $73.09 because of the company's recent volatility and disappointing reports.
- Safety: TSLA has a Relative Safety score of 1.21, well above average on a scale of 0.00 to 2.00, related to its large market cap and ability to sustain itself during financially stressful times.
- Relative Timing: The relative timing of TSLA is 0.55, rated as poor on a scale of 0.00 to 2.00. The metric considers the stock movements daily, weekly, quarterly, and yearly, so even with the poor earnings report, the overall timing of FedEx is favorable considering all timelines and comparisons for the company.
The overall VST rating of TSLA is 0.85, which is considered above average and is followed by a SELL recommendation in the VectorVest system. SELL indicates that if you own the stock, you should NOT keep it in your portfolio and sell it, and if you’re not already invested, definitely don’t buy any stock.
The reaction to TSLA’s decline in deliveries was off-putting for investors for a good reason, and VectorVest shows the company's performance as an overview. You can see the trajectory and risks associated with the company through the Poor Upside Potential. You can learn more about how the system works or the current opportunity with any given stock through a free stock analysis today!
Want These Types of Insights at Your Fingertips so You Can Win More Trades?
Use VectorVest to analyze any stock free. VectorVest is the only stock analysis tool and portfolio management system that analyzes, ranks and graphs over 18,000 stocks each day for value, safety, and timing and gives a clear buy, sell or hold rating on every stock, every day.
VectorVest advocates buying stocks with proper analysis, not just the market’s movements for that day. TSLA’s poor deliveries and production aren’t an isolated incident but a string of unfortunate events for the company. VectorVest helped investors visualize its financial health. The stock has poor upside potential, good safety, and poor relative timing, with a recommendation to SELL. Allowing you to see all the necessary components to make an informed decision.
Before you invest, check VectorVest! Click here to ANALYZE ANY STOCK FREE and see our system in action!
What you should do next…
- Get our latest blogs delivered right to your inbox, subscribe to our newsletter.
- The market moves fast! Get our most current evaluation of this stock with our FREE stock analysis tool.
- Looking for stock picks? Not sure if now is the right time to buy/sell? For a limited time, enjoy the full benefits of a 30-day subscription to VectorVest for only $0.99 (usually up to $148/month) . Get access to our full list of screeners showcasing our top stock picks that tell you exactly what to buy, when to buy, and when to sell.






Leave A Comment