by Leslie N. Masonson, MBA
Modine Manufacturing Company (MOD:NYSE), an old-line diversified global leader in heat-transfer systems and components company incorporated in Racine, Wisconsin in 1916, may be on the brink of finally breaking out to a new all-time high. On November 18, 1998, almost twenty-five years ago, it closed at $36.63 before enduring trials and tribulations while the stock price waffled for years.
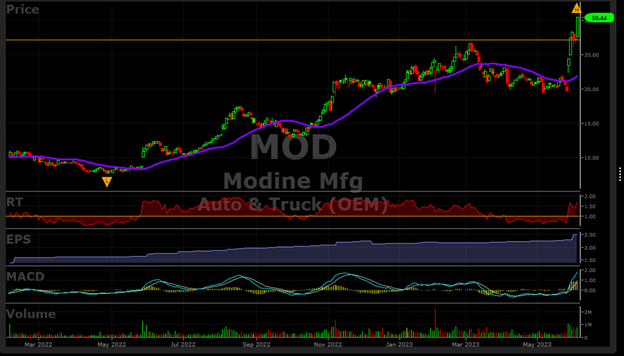
From 2007 to May 2023, the stock fluctuated between a mere $0.73 (in early 2009) and a modest $27 (in 2008), only to hit the $27 threshold once again in the recent week’s closing surge. The company’s shares leaped 11%, propelled by an upswing in trading volume, to culminate at a noteworthy $30.44.
Certainly, the probability of it reclaiming and surpassing its previous pinnacle that is 20% higher appears in reach, as more institutional and savvy investors’ eyes are watching the stock. The May 24 blow-out earnings report catapulted the stock higher on more than double typical daily volume starting on Tuesday of this week and continuing the rest of the week. Accumulation of this stock is definitely taking place.
On Friday alone the stock jumped $3.30 or 12.2% on 773,000 shares compared to its average volume of less than half that. And over the last six trading days, MOD is up an impressive 53.3% Check out the chart at the bottom of this article.
It comes as no surprise that the majority of investors remain oblivious to the existence of Modine, despite its century-long existence. The reason for such unfamiliarity becomes evident when one takes into account its geographical roots, nestled within the manufacturing hub of the Midwest, coupled with its line of products that fails to capture the glitz and glamor typically associated with hot stocks, sectors or themes. Nonetheless, this may be a case of the proverbial “needle in the haystack,” wherein hidden treasures lay concealed.
Strong 2022 4th quarter earnings and fiscal year ending on March 31, 2023. Net sales increased to $618.1, 8% above prior year numbers. Likewise, operating income jumped 135% due to restructuring, and adjusted EBITDA increased 16% from a year earlier. Earnings per share of $1.69 compared to $0.16 was a major milestone. President and Chief Executive Officer, Neil D. Brinker expressed his satisfaction with these results declaring in a press release: “Fiscal 2023 was an important year for Modine as we made tremendous progress executing against our strategic plan and delivered strong financial results, which we expect to replicate in fiscal 2024,” Of course, investors should perform their own due diligence before putting money at risk.
MOD Has Five Excellent VectorVest Scores, And It is Undervalued – A Powerful Combination
How did I find this stock out of the 9,128 that VectorVest tracks? Simple, I opened StockViewer and there it was ranked 13th based on VST. Since I never heard of the company, even after following the markets for over six decades, that high ranking piqued my attention. Out of curiosity, I then checked its VST rank on May 23, a day before the earnings release, and found it was ranked way down at 928. Obviously, this meteoric rise in rankings is one that needs to be watched closely for further follow-through. So, I then checked its metrics and was blown away by their consistency, as you see below. This is the perfect example of why paying attention to the Stock Viewer top stocks can find the hidden gems to investigate further, so you can then make a non-emotional decision to buy or sell a position.
VectorVest’s MOD’s key metrics are as follows:
- Excellent Upside Potential: The Relative Value (RV) rating focuses on a stock’s long-term, three-year price appreciation potential. The current RV rating for MOD is 1.40 which is well above average on a scale of 0.00-2.00. The current stock price is $30.44, while VectorVest pegs its value at 32.27.
- Good Safety: The Relative Safety (RS) rating is based on the company’s business longevity, financial predictability/consistency, debt-to-equity ratio, and additional risk parameters, including price volatility. Its RS rating of 1.09 is above average, indicating slightly above-average risk.
- Excellent Timing: The Relative Timing (RT) rating focuses on the price trend over the short, medium, and long term. The components include price direction, dynamics, and price magnitude of price changes over daily, weekly, quarterly, and yearly comparisons. MOD has an exceedingly high RT rating of 1.68 compared to the average 0.98 RT of all the stocks in the database which means that the stock has been much better than average over multiple timeframes, but in this case over the past six days.
- Excellent Comfort Index: This index measures the consistency of a stock’s long-term resistance to severe and lengthy corrections. This index compares the individual stock to the fluctuation of the VectorVest Composite price that is measured on a scale of 0 to 2.00. At a level of 1.75, MOD’s rating is significantly above average. Therefore, this stock can be considered by both conservative and aggressive investors.
- Excellent Growth Rate (GRT): MOD’s 23% forecasted growth rate is measured over a forecasted three-year period. This fundamental factor is calculated in the VectorVest software, so you don’t have to do the work. The chart below highlights the near-term positive earnings trend over time, which has been improving recently.
- Excellent VST Score: The VST Master Indicator ranks 9,128 stocks from high to low and brings stocks with the highest VST scores to the top of the list. MOD’s VST is 1.43 which is considered a high score. Using VST enables users to identify stocks that are performing much better than average, as well as those performing much worse than average. Clearly, MOD falls in the former category, and why it is currently rated a “BUY ”.
Considering the five “excellent” metric ratings, this stock is one of the highest rated ones in the universe and one that most investors should definitely place on their watch lists. After its recent 54% price advance, potential buyers should wait for a pullback before considering a purchase. The stock is overextended in the short-term, so no need to step in and take a hit if it gives back a chunk of this latest advance.
Before jumping on board, keep the following factors in mind: price remains above $27.23, MACD remains positive, RT remains above 1.00, and the price remains above its 40-DMA of $21.92. The safest approach is to buy only when the overall VectorVest stock market signal is “bullish” which is not the current situation. Check VectorVest’s recommendation if the stock falls more than 10% from current levels. Analyze it for free using VectorVest.
Want These Types of Insights at Your Fingertips so You Can Win More Trades?
Use VectorVest to Analyze any stock free. VectorVest is the only stock analysis tool and portfolio management system that analyzes, ranks and graphs over 18,000 stocks each day for value, safety, and timing and gives a clear buy, sell or hold rating on every stock, every day.
Before you invest, check VectorVest! Click here to ANALYZE ANY STOCK FREE and see our system in action!
What you should do next…
- Get our latest blogs delivered right to your inbox, subscribe to our newsletter.
- The market moves fast! Get our most current evaluation of this stock with our FREE stock analysis tool.
- Looking for stock picks? Not sure if now is the right time to buy/sell? For a limited time, enjoy the full benefits of a 30-day subscription to VectorVest for only $0.99 (usually up to $148/month) . Get access to our full list of screeners showcasing our top stock picks that tell you exactly what to buy, when to buy, and when to sell.


Leave A Comment