Shares of Airbnb (ABNB) had been climbing steadily over the past month – up nearly 15%. That is, until a viral tweet stirred fear over a dramatic drop in Airbnb revenue. Today, the stock is down nearly 3%. What happened?
On Tuesday evening, Reventure Consulting CEO Nick Geril pointed out a steep drop-off in short-term rental data in some of the most visited cities in the US. The chart Geril shared compared revenue per available listing calculated on a 3-month basis from May 2022 to 2023.
“The Airbnb collapse is real”, Geril says. The chart he shared certainly points out a valid concern, with revenues dropping nearly 50% in cities like Phoenix, Austin, Myrtle Beach, and more.
Geril continued, stating that it’s his belief that Airbnb property owners are going to sell off in droves later this year, as it will get to the point where revenues can’t cover the mortgage on the property. This will be especially troublesome for those new to Airbnb who purchased their properties at a high price with a high-interest rate – as these individuals have little room for error.
That being said, Jamie Lane – chief economist and senior vice president of analytics at AirDNA – takes a different stance. He believes that the figures Geril pulled are inaccurate. While he agrees that revenue is down, it’s not nearly as high as 40%+.
An Airbnb spokesperson chimed in to echo Lane’s statement, citing that the data Geril shared is inconsistent with the company’s internal data. This spokesperson pointed back to Airbnb’s 1st quarter earnings report, which we recently wrote about. There, the company reported an increase in Nights and Experiences booked – a key indicator of demand for Airbnb.
All of this said, we’ll have to wait and see what the future holds for Airbnb as a company and Airbnb property owners. One thing is for sure, though – there won’t be any slowing down this summer. Surveys predict 10% growth in vacation spending for the season over last year, and the upcoming 4th of July holiday is set to be the busiest in history from a travel standpoint.
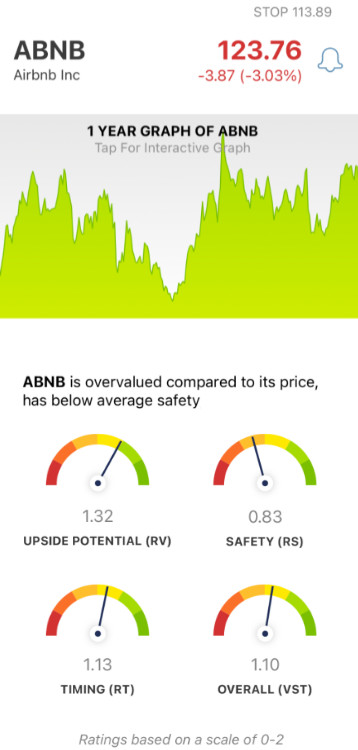
So, what does this mean for investors of ABNB – or even potential investors wondering if they should get in? To help you tune out the noise and focus on what matters most from a stock analysis standpoint, we’ve analyzed ABNB through the VectorVest stock forecasting software below.
Despite Poor Safety, ABNB Still Has Good Timing and Very Good Upside Potential
The VectorVest system helps you simplify your approach to trading by giving you all the insights you need in just 3 ratings: relative value (RV), relative safety (RS), and relative timing (RT).
Each rating sits on a scale of 0.00-2.00, with 1.00 being the average. This makes interpretation quick and easy. But it gets even better. Because based on the overall VST rating for a given stock, the system issues a clear buy, sell, or hold recommendation - at any given time. As for ABNB, here’s the current situation:
- Very Good Upside Potential: While some worry that ABNB is set to crash, we see that the stock actually has very good price appreciation potential - as indicated by the RV rating of 1.32. This rating compares a 3-year price projection to AAA corporate bond rates and risk.
- Poor Safety: The biggest issue for this stock right now is risk and uncertainty. The RS rating of 0.83 is poor. It’s calculated through an analysis of the company’s financial consistency & predictability, debt-to-equity ratio, and business longevity.
- Good Timing: In terms of the stock’s price trend, the timing is good for ABNB right now - with an RT rating of 1.13. This is based on the direction, dynamics, and magnitude of the stock’s price movement. The rating is calculated day over day, week over week, quarter over quarter, and year over year.
In the end, ABNB has a good overall VST rating of 1.10. But, in coupling all this with the concern of a looming rental revenue crash, what should you do with this stock from an investment standpoint?
A clear buy, sell, or hold recommendation is just a few clicks away. Get a free stock analysis today to make your next move with complete confidence and clarity.
Want These Types of Insights at Your Fingertips so You Can Win More Trades?
Use VectorVest to analyze any stock free. VectorVest is the only stock analysis tool and portfolio management system that analyzes, ranks and graphs over 18,000 stocks each day for value, safety, and timing and gives a clear buy, sell or hold rating on every stock, every day.
VectorVest advocates buying safe, undervalued stocks, rising in price. While there is concern with ABNB’s poor safety, the stock still has good timing and very good upside potential. Before today, the stock was riding a trend that pushed its price higher and higher.
Before you invest, check VectorVest! Click here to ANALYZE ANY STOCK FREE and see our system in action!
What you should do next…
- Get our latest blogs delivered right to your inbox, subscribe to our newsletter.
- The market moves fast! Get our most current evaluation of this stock with our FREE stock analysis tool.
- Looking for stock picks? Not sure if now is the right time to buy/sell? For a limited time, enjoy the full benefits of a 30-day subscription to VectorVest for only $0.99 (usually up to $148/month) . Get access to our full list of screeners showcasing our top stock picks that tell you exactly what to buy, when to buy, and when to sell.


Leave A Comment