Nike stock plunged 12% this morning after another earnings report that missed expectations. While revenue and EPS figures came in strong, the margins slipped up a bit – which has only been exacerbated by inflation. But the real reason analysts and investors alike have growing concern over the trajectory of Nike? Inventory.
Their inventory is up 44% – with over $9.6 billion sitting in stock just waiting to be sold. This isn’t an issue that’s unique to Nike, though. Direct To Consumer companies everywhere have experienced a slowing demand this year as inflation continues to persist and fears of a recession loom. Further, consumption has dropped by comparison to the pandemic levels that companies used as forecasts for their inventory purchases – and Nike is definitely feeling the effects of that.
But is a slow economy the only reason for Nike’s poor earnings report? This is not the first time in recent memory that the company has reported solid revenue and EPS figures with lackluster margins. One analyst begs the question – why is Nike continuing to force sales and chase volume, rather than raising prices and selling less to raise margins back up? This is the concern BMO Capital Markets Managing Director Simeon Siegel has. He also states that while Nike continues to show a strong competitive advantage, they are looking more and more like the rest of the pack – over-inventoried and chasing promotions.
However, another analyst has a different take. Jefferies Managing Director Randal Konik still rates Nike a buy but did lower his price target down to $115. He recognizes that near-term pain will persist for the stock. However, the long-term picture for Nike hasn’t changed in his viewpoint. This is still one of the biggest brands in the world we’re talking about, after all. He claims Nike remains well-positioned despite inflationary pressures.
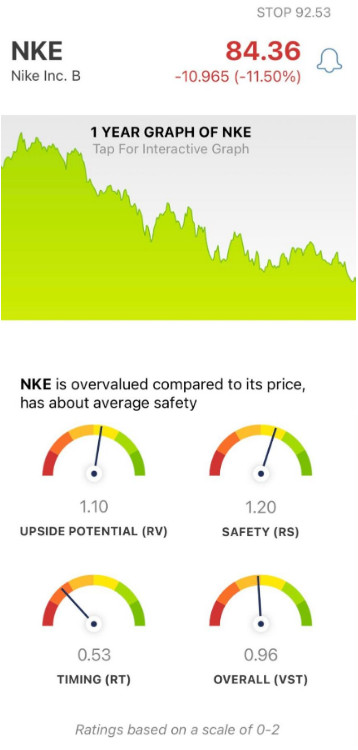
However, we’ve seen huge companies like Nike fall in the past. And, purely from an investing standpoint, how long can you hold onto your position before cutting losses and looking for a lower entry point in the future? Nike stock is down over 42% in the past year. And with the negative price trend that’s formed after this earnings report, it doesn’t appear to be slowing down any time soon.
With that said, let’s take a look at what the VectorVest stock market analysis software has to say about Nike. Through this system, you can gain a clear recommendation on what your next steps with Nike should be.
Despite Good Upside Potential & Safety, Nike has a Strong Downward Price Trend
The VectorVest system makes investing less complicated – even for those with no experience. You can learn everything you need to know about any given stock based on just three proprietary ratings: relative value (RV), relative safety (RS), and relative timing (RT). These sit on a simple scale of 0.00-2.00 with the higher end of the range indicating higher performance. And based on these three ratings, you’ll be given a clear buy, sell, or hold recommendation. Here’s the current situation with Nike:
- Good Upside Potential: the long-term price appreciation potential for Nike remains good, with an RV rating of 1.10. This is calculated up to three years out and offers a far superior indication of the true value a stock has in the long run. However, VectorVest does calculate Nike to be overvalued – with a current value closer to $68. This suggests the price correction we’re seeing is overdue.
- Good Safety: even as Nike’s stock price continues to fall, the risk this stock carries remains relatively low with an RS rating of 1.20. This is calculated from a deep analysis of Nike’s financial predictability and consistency, along with its business longevity, debt-to-equity ratio, and more.
- Poor Timing: The main issue with Nike stock that investors need to be aware of is the poor timing it has right now – with an RT rating of 0.53. This indicates the negative price trend we’ve seen may not be slowing down. The RT rating takes into account the direction, dynamics, and magnitude of a price trend – in the short, mid, and long term.
All things considered, the VST rating of 0.96 for Nike is fair – and just below the average. Does that mean you should continue holding, though? Or, is the price trend too strong – suggesting the time to sell is right now (or even a few days ago)?
You don’t have to play the guessing game or let emotion dictate your next move. Get a clear buy, sell, or hold recommendation for Nike through a free stock analysis.
Want These Types of Insights at Your Fingertips so You Can Win More Trades?
Use VectorVest to Analyze any stock free. VectorVest is the only stock analysis tool and portfolio management system that analyzes, ranks and graphs over 18,000 stocks each day for value, safety, and timing and gives a clear buy, sell or hold rating on every stock, every day.
VectorVest advocates buying safe, undervalued stocks, rising in price. As for NKE, it is overvalued but has fair upside potential and safety nonetheless. However, the real problem is the strong downward price trend.
Before you invest, check VectorVest! Click here to ANALYZE ANY STOCK FREE and see our system in action!
What you should do next…
- Get our latest blogs delivered right to your inbox, subscribe to our newsletter.
- The market moves fast! Get our most current evaluation of this stock with our FREE stock analysis tool.
- Looking for stock picks? Not sure if now is the right time to buy/sell? For a limited time, enjoy the full benefits of a 30-day subscription to VectorVest for only $0.99 (usually up to $148/month) . Get access to our full list of screeners showcasing our top stock picks that tell you exactly what to buy, when to buy, and when to sell.








Leave A Comment