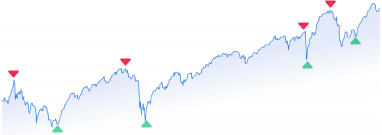
To accurately identify potential stocks and determine your entry and exit points, you’ll rely on swing trading indicators. These are what signal opportunities to you. And as you have probably begun to realize – there are a lot of different indicators. Do they all have their place? Yes. Do you need to rely on all of them? Absolutely not.
In fact, using too many different swing trading indicators can lead to overcomplicating and overthinking. Why not simplify your trades by just focusing on the best indicators for swing trading?
Today, we’ll help you discover the top indicators and explain how to use them to your advantage. Then, we’ll let you in on a little trading secret that will transform the way you look at indicators forever.
What Are Swing Trading Indicators?
If you’re familiar with how swing trading works, then you know that traders look for trends and patterns to identify opportunities. The goal is to get a position in a stock that has pulled back in price from a longer-term uptrend and the longer-term trend reasserts itself – and get out before it trends back down. But how do you find these opportunities and validate them? That’s right – using indicators.
Swing traders use indicators to help them make informed decisions. But what exactly is a swing trading indicator? This is a mathematical model that helps you understand trends and data.
You can use a swing trading indicator to predict various aspects of a stock’s price: will it go up, down, or remain stagnant? What is the potential for this stock – both in terms of gains and losses?
With the best swing trading indicators, you can make accurate predictions about what a stock will do. You’ll be able to tell if a trend is bullish or bearish and what the momentum behind that trend is.
This helps you identify which stocks you want to trade, while also helping you identify the proper entry and exit point. You can lay these indicators across a stock’s chart. They work on daily charts, weekly charts, or any other chart you use to assess a market situation.
The Importance Of Understanding Swing Trading Indicators
It should come as no surprise that these indicators are important. Your entire swing trading strategy is going to be based on them, after all. As such, you must understand the basics – even if you’re using a stock prediction software that simplifies the basic indicators for you (more on that later).
Having an in-depth understanding of these will gain you an edge in identifying the right stocks for your unique risk level and trading style. And, you’ll be able to determine the right time to get in and the right time to get out.
Without a proper understanding of trend, momentum, and volume indicators, you won’t get in fast enough and you won’t get out fast enough. Timing is everything. So, let’s quickly break down the three different types of indicators.
Trend Indicators
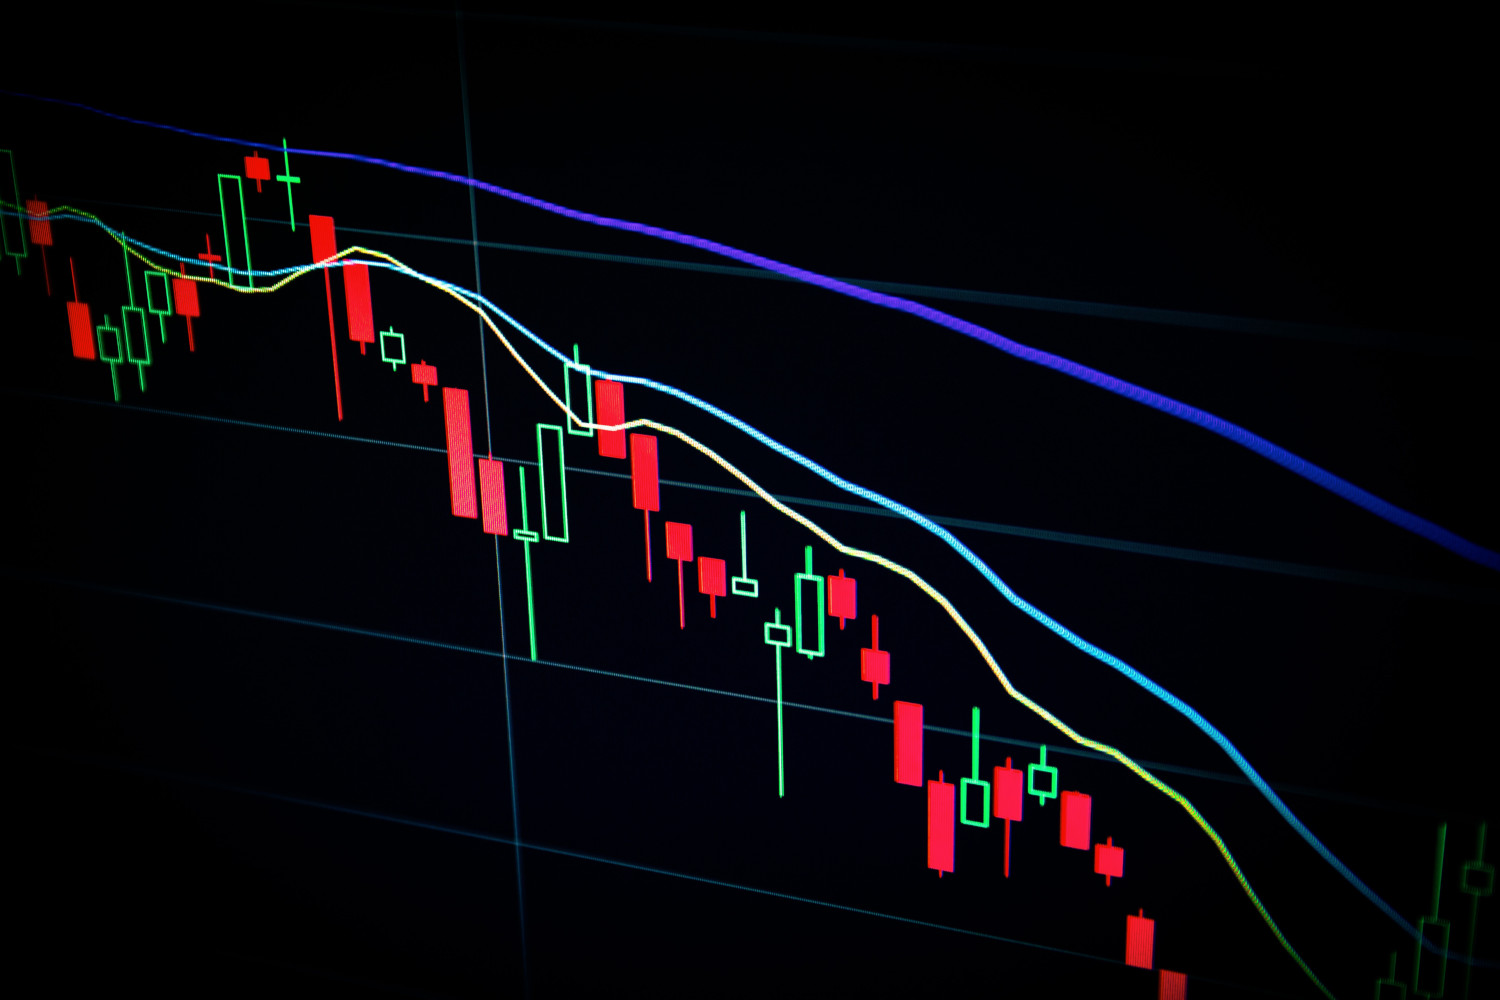
Trend indicators show you which direction the market is going. The most common type of trend indicator – which you’ll learn more about below – is the moving average. These types of indicators are used to smooth price volatility and identify a trend – if one even exists.
Momentum Indicators
Once you know a trend exists, how strong is it? That’s where the momentum indicator comes in. It shows exactly how much wind is in that trend’s sails – and whether you should be concerned about an upcoming reversal in that trend.
If a stock is overbought or oversold, it’ll be shown in these momentum indicators. The RSI (relative strength index) is a popular momentum indicator that you’ll learn more about below.
Volume Indicators
Volume indicators are pretty simple – they just display how many swing traders are actively trading a given stock. This can help you confirm the strength of a trend. High volume means high strength – low volume indicates the opposite.
The Best Indicators For Swing Trading
Now that you know the three different types, we’re ready to unveil our list of the best swing trading indicators. These are the basics that any beginner should know, as you’ll still use them as an experienced trader. We’ll kick things off with the moving averages.
Moving Averages
Abbreviated as MA, the moving average has long been considered one of the best swing trading indicators in technical analysis. You’ll use it to confirm trends in price movement. Because this falls into the category of lagging indicators, you would rarely use the moving average to predict future price movement.
There are two types of moving averages you should be aware of: exponential moving averages (EMA) and simple moving averages (SMA). Both are important, but the exponential moving averages will give you access to the most recent price action.
So, how do you use these moving averages? You’ll need to also distinguish between shorter-term MAs and longer-term MAs. Watch for a short-term moving average that crosses a long-term moving average. When this happens, it may be a good time to buy – this is a bullish signal.
MACD (Moving Average Convergence Divergence)
Another really helpful trend indicator for swing traders is the MACD, or the moving average convergence divergence. This slightly more complex indicator combines the SMA and EMA we discussed above and offers more insights. It helps you confirm a trend while granting you a look into the momentum behind it, too.
MACD calculates the difference between the EMA and SMA. While best practice is to take a 26-period EMA and 12-period SMA, your unique trading style/risk levels may affect the periods you use. You can overlay the MACD on your stock’s chart and watch for it to cross above the signal line as a sign that it’s time to buy. Conversely, it’s time to sell when the MACD crosses under the signal line.
You can also use the MACD to predict reversals. By looking for divergence between the histogram and price action, you can make accurate predictions that a reversal is on the horizon.
RSI (Relative Strength Index)
A pure momentum indicator, the RSI has become the go-to indicator for crypto trading in particular. It helps you identify whether a stock is oversold or overbought based on the magnitude of the price change.
The RSI is displayed as an oscillator. You’ll use this line graph to determine where a stock falls on a range from 0-100. A higher number indicates a more overbought stock, while a lower number indicates an oversold stock.
This is a really important indicator to monitor as it can help you get in or out of a stock at the right time. For example – as the RSI climbs above 70, you can assume the stock is overbought and a reversal is on the horizon. Similarly, as the RSI drops below 30, you can predict an upcoming reversal as the bearish trend ends.
Bollinger Band
This is another of the many lagging indicators you’ll use to assess momentum in a stock’s trend. The Bollinger band tool gives you a look at how high or low a price is relative to previous trades. What does this tell you, though? It indicates how volatile the market is, while also giving you insights into whether the stock is overbought or oversold.
Swing traders love using the Bollinger band because it’s a clean, easy indicator to use. It relies on moving averages along with two standard deviations: one positive, one negative. As the gap between these standard deviations widens, market volatility increases. As these standard deviations start to converge on the moving average, there is less volatility.
Volume
The volume indicator is perhaps the most simple of all – but also one of the most important. It shows you exactly how much of a stock is being traded, and how distinguished a newly formed trend is.
The more volume, the more people are buying/selling a stock. This helps you confirm the trend. High volume means a strong trend, whereas weak volume indicates a weak trend. Simple enough, right? And yet – so many swing traders overlook this helpful indicator. Don’t make the same mistake.
Stochastic Oscillator
The final indicator we want to cover is the Stochastic oscillator. This is yet another momentum indicator. While it gives you access to the same type of information as the relative strength index, it does so using different mathematical models. You’ll look at the same 0-100 range as the RSI, but the overbought and oversold levels fall at 80 and 20 respectively.
And, instead of a single line on a chart – you’ll have two. The first, of course, is the stochastic oscillator. The other is a 3-day moving average. Why? Because when the two lines close in on each other and end up crossing, it indicates a reversal is coming.
Bullish Candlestick Reversal Patterns
A final swing trading pattern we want to discuss is candlesticks – specifically, the bullish candlestick reversal patterns. These patterns suggest that the support has a high probability of holding and that the advance has begun. There are quite a few different candlestick patterns out there, but a few worth following are:
- Bullish engulfing
- Hammer
- Morning Star
Following these patterns requires validation of their strength through volume indicators. Once you see a hammer, for example, you should watch for a rise in trading volume to confirm the pattern before entering.
Swing Trading Indicators Simplified With VectorVest
As a swing trader, the 6 indicators above are going to be your bread and butter. You can use just these technical indicators to execute your trades. However, there are many others. And the reality is, looking at these technical indicators can get overwhelming. What if technical analysis could be brain-dead simple? With VectorVest, it can be.
The VectorVest stock forecasting tool is unlike anything before. It will transform the way you trade forever. It combines all indicators into three easy-to-understand metrics: Value, Safety, and Timing. You can quickly pull up any given stock in the software and immediately be given these metrics – which range from 0-2.
Relative Value (RV)
Relative value shows you whether a stock is undervalued or overvalued. A stock rated with an RV above 1.00 has an above-average appreciation potential. On the other hand, a stock with an RV under 1.00 is a red flag – it’s overvalued.
Relative Safety (RS)
Along with the value of a stock, you should consider its safety. An RS over 1.00 indicates it’s safer and less volatile than a stock under 1.00. Your specific risk tolerance will affect the manner in which you use RS.
Relative Timing (RT)
Perhaps the most important metric of the three is relative timing (RT). This tells you how the short-term performance of a stock looks. Anything over 1.00 is good, and below 1.00 means that the timing isn’t quite right. A flat price trend will just sit at 1.00.
Assess Overall Market Conditions With Ease
With any investing strategy, the overall direction of the market matters. Are things trending up over the past 10 days, or are they trending down? This information should influence your strategy. And fortunately for you, VectorVest simplifies this, too. Right on the home page of our platform you can assess the overall market sentiment – we tell you whether it’s a good time to buy stocks in general, or whether you should consider closing your positions and converting to cash.
Evaluate Industry & Sector Performance
Another manner in which VectorVest simplifies swing trading for you is by helping you evaluate industry and sector performance. You want to enter industries or sectors of the economy that are on your side. If a particular industry is going through a downturn, you probably wouldn’t want to stake a position in stocks that fall under that industry. But how can you tell whether an industry or sector is performing well or not?
In the VectorVest platform, simply load the industry group on the viewers page. Then, resort by RT (relative timing). You’ll be presented with industries that are prime for entering positions in.
Pick The Highest VST And Win Your Trades
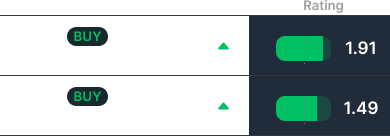
These three metrics make up the VST (value, safety, timing) rating we give a stock – which is computed from the square root of a weighted sum of the squares – like the Vector formula in physics. With this VST, we’re able to give you a clear recommendation of buy, sell, or hold – for any given stock. Take all the guesswork and emotion out of your investment strategy – with VectorVest. Want to see what it looks like in action? Get your free stock analysis today.
Final Thoughts On The Best Indicators For Swing Trading
Now that you know the best indicators for swing traders, you’re ready to get started doing technical analysis like the pros. But the reality is that using these technical indicators – while helpful – is outdated. Why not make things easier on yourself with a proven trading system like VectorVest?
With our platform in your trading arsenal, you’ll get market guidance, time-tested investing strategies, and individual stock recommendations. And, you can get started today with a 30-day free trial. Experience the difference for yourself and you’ll never go back to trading the old way.
What you should do next…
- Get our latest blogs delivered right to your inbox, subscribe to our newsletter.
- The market moves fast! Get our most current evaluation of this stock with our FREE stock analysis tool.
- Looking for stock picks? Not sure if now is the right time to buy/sell? For a limited time, enjoy the full benefits of a 30-day subscription to VectorVest for only [offer_txt] (usually up to [saving_txt]/month) . Get access to our full list of screeners showcasing our top stock picks that tell you exactly what to buy, when to buy, and when to sell.

