by Leslie N. Masonson, MBA
Buy-and-hold investing is recommended by most financial advisors, mutual fund sponsors, and many professional money managers. Their reasoning is that the markets have a long-term upward bias, so stay fully invested at all times. They say, “Time in the market is more important market timing.” Warren Buffett says he never has an opinion of the market. David L. Babson said: “Market timing is impossible to perfect.”
Buy-and-Hold Backdrop
Jack Bogle, founder and retired CEO of The Vanguard Group, was a vociferous advocate of buying-and-holding, and keeping your investing process simple and focused on the very long term. Bogle, who passed away at age 90 in January 2019, kept all his money in low-cost index funds, mostly at Vanguard.
The logic behind buy-and-hold is that no one can forecast the market with accuracy or consistency. Therefore, you don’t want to be guessing when the best time to enter or exit is, and most often you will be wrong anyway. That’s what Wall Street wants us to believe.
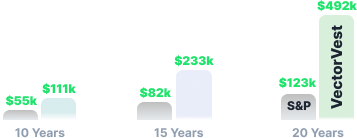
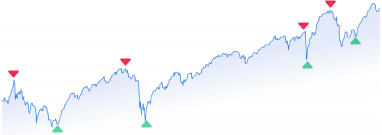
Nonetheless, you and I know that market timing works because we use VectorVest to make money in both bull and bear markets, and we cut losses to protect principal, not letting our portfolio lose a whopping 25% or more.
But we are in the minority, and it feels good to be a contrarian to Wall Street propaganda and succeed. Nevertheless, many investors are very conservative and believe the buy-and-hold mantra is the way to go. So, I wanted to offer those investors some ETFs ideas.
Thousands of ETFs to Choose From
Investors preferring the buy-and-hold approach have a plethora of ETFs to choose from, whether they are one or more of the 1,901 passively managed ETFs or a few of the 810 actively managed ETFs, or a combination of both. Most investors will not need more than five ETFs to have a diversified portfolio. And the passive funds offer extremely low annual expense ratios (0.00% to 0.10%), so those are preferred. The asset leaders provide the largest selection of desirable ETFs, and those sponsors include Blackrock, Vanguard, State Street, and Invesco among others.
Investors should compare similar ETFs for each sponsor by going to their website to view the particulars, especially the AUM, cost, dividends, and risks. More aggressive investors may want to add a few 3% to5% allocations to specialty ETFs to add some pizzazz to their portfolio, such as the Technology Select Sector SPDR Fund (XLK) or Invesco QQQ, and JEPI (covered call strategy), for income. Note the expense ratio for XLK is a reasonable 0.10% compared to a higher 0.20% for QQQ, and 0.35%. for JEPI.
One Buy-and-Hold Portfolio Using Vanguard ETFs
One very popular mutual fund and ETF sponsor is Vanguard, which has millions of clients. Vanguard offers many ETF equivalents of its own mutual funds. Therefore, investors looking to buy-and-hold, can select among the Vanguard ETFs or any other comparable ETFs offered by the competition with low annual expense ratios and billions of dollars under management. These ETFs are all passively managed index funds so the expense ratios are just a couple of basis points (0.03%, for example).
One simple diversified buy-and-hold strategy is to purchase three ETFs that cover the U.S. market, international markets, and bonds. Those three categories can easily be covered by using three ETFS: Vanguard Total Stock Market ETF (VTI), Vanguard FTSE Developed Markets ETF (VEA), and Vanguard Total Bond Market ETF (BND) with a 33.3% position in each, or any weighting that you prefer based on your age, time horizon and risk tolerance.
These three ETFs provide a portfolio of 3,814; 4,036; and 17,699 stocks, respectively, certainly a huge portfolio, where no stocks dominate to greatly impact the results. This is mentioned as a point of information since the “Magnificent 7” tech stocks dominate the S&P 500 Index with a 25% weighting which has a major impact on the index’s performance in both good and bad markets.
How have three Vanguard ETFs performed over a 10-year annualized basis ending August 25, 2023? Here are the numbers:
- VTI 11.62%
- VEA 4.56%
- BND 1.41%
Blending the results based on the equal percentage originally invested, the weighting average annual return is only 5.86%, nothing to brag about because of the negative impact of the international stocks and bonds. That is to be expected in a long-term, bull market run. And in a bear market the bond position will usually hold up well to offset the loss in stocks. But as we know, that did not work out well in 2022 where both stocks and bonds got clobbered. During that year, the S&P 500 Index declined 19.4%, the Nasdaq Composite 33.1%, and the Bloomberg U.S. Aggregate Bond Index fell 13.01%
VTI did beat the Dow-Jones Industrials ETF (DIA) by 72 basis points, but underperformed the S&P 500 ETF (SPY) by 55 basis points with those indexes showing the following returns over that 10-year period: DIA +10.90% and SPY +12.17%. Note that since inception, VTI has had an annualized return of 8.37% compared to the SPY’s 8.01% and the DIA’s 8.36%.
Rebalancing Option
One important consideration that investors focus on is rebalancing their portfolios, on a periodic basis, to the original percentage allocations so they are not out of sync with the original allocation percentages. For example, if the VTI ended up one year with a 40% allocation instead of its original 33.3% allocation, investors would sell enough shares to get the three portfolios back to mix to one-third each. Jack Bogle, for one, did not believe that rebalancing added much value. His reasoning is “Why sell your best performers?” That is a good point, but everyone should make their own decision on the need for rebalancing based on risk tolerance, age, and timeframe.
Bear Market Negatively Impacts Buy-and-Hold Portfolios
One significant problem with buy-and-hold investing is that investors have to sit through bear markets which may take years to recover from. Remember the March 2000 to September 2001 bear market with a loss of 36.7%; January 2002 to October 2002 with a 33.8% loss; October 2008 to November 2008 with a loss of 51.9%, and January 2009 to March 2009 loss of 27.6%, and don’t forget the last bear market from January 3, 2022 to October 22,2022 where the S&P 500 lost 35.43%. During the pandemic in 2021, the S&P cratered 34.3% in three months before miraculously recovering the entire collapse by August 3, 2021.
Moreover, experiencing a bear market at the wrong time, such as when you need the money for a college education for your child or grandchild, to buy a house, or for a comfortable retirement can be a big downer in many respects. Nevertheless, many investors believe that it is easier to just hold for the long-term even though they may feel uncomfortable during the down periods. VectorVest subscribers know that buy-and-hold is dangerous and is to be avoided, but that won’t stop many investors from following that long-held Wall Street belief that buy-and-hold is the best strategy.
In summary, if investors prefer the buy-and-hold approach, they will find that ETFs offer an excellent option to mutual funds and individual stocks since they offer low-cost expense ratios, intra-day pricing, liquidity, tax efficiency, diversification, and provide a way to inject a few specialized ETFs for the more venturesome.
Want These Types of Insights at Your Fingertips so You Can Win More Trades?
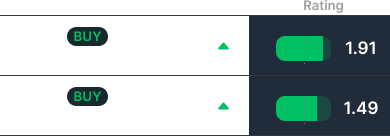
Use VectorVest to Analyze any stock free. VectorVest is the only stock analysis tool and portfolio management system that analyzes, ranks and graphs over 18,000 stocks each day for value, safety, and timing and gives a clear buy, sell or hold rating on every stock, every day.
Before you invest, check VectorVest! Click here to ANALYZE ANY STOCK FREE and see our system in action!
What you should do next…
- Get our latest blogs delivered right to your inbox, subscribe to our newsletter.
- The market moves fast! Get our most current evaluation of this stock with our FREE stock analysis tool.
- Looking for stock picks? Not sure if now is the right time to buy/sell? For a limited time, enjoy the full benefits of a 30-day subscription to VectorVest for only [offer_txt] (usually up to [saving_txt]/month) . Get access to our full list of screeners showcasing our top stock picks that tell you exactly what to buy, when to buy, and when to sell.


