by Leslie N. Masonson, MBA
Purchasing ETFs is more complex than purchasing mutual funds and individual stocks when you take into account their key attributes and the dizzying number of choices available. With a universe of 3,159 ETFs, investors and traders struggling to select a few ETFs for their regular and retirement portfolios may be overwhelming as to determine what data elements are critical to review. That is the purpose of this article is to answer that question.
Before one can invest in ETFs, it is necessary to open a brokerage account. Be sure to select one that offers no commission trades for stocks, ETFs and possibly options (or a low charge). If you have a good handle of the type of investor you are (conservative, moderate or aggressive) and know your risk tolerance level (low, medium or high), then the next step is to determine how much you want to invest in ETFs for your regular and/or retirement accounts.
Basic ETF Review
You may simply want to buy passive ETFs with low annual expense ratios for your retirement account. You have a wide choice available from Vanguard, Blackrock, and Invesco, for example. Check out their ETF offerings on their website. In particular look at:
-
- Summary Prospectus – providing a bird’s-eye-view of the ETF’s objective, annual expense ratio, inception date, active or passively managed, rebalance dates and risks.
- Fact Sheet – providing the performance to date, list of Top 10 holdings, comparison to its benchmark and other data.
Other critical information to observe from these documents include:
-
- Market cap or equally-weighted – which will greatly impact performance
- Riskiness of portfolio components – standard deviation and Sharpe Ratio
- Top 10 ETFs – percentage of portfolio – 40% or more indicates those stocks will drive the performance
- Number of holdings – the more holdings the less risky in general
- Securities Lending Fees – whether a portion of the income earned by the fund to lend stocks to short sellers is passed on to ETF holders
- Portfolio Turnover – especially if an active ETF; and the higher the turnover the more in commissions they pay to transact them which eats into the portfolio return
- Annual performance – in recent years and since inception against its benchmark. Determine if the benchmark was reached or exceeded.
Moreover, by using one or more free ETF websites such as www.etf.com and www.etftrends.com you can compare similar ETFs from other sponsors. Key factors to compare include assets under management, average daily trading volume, dividend payments, Sharpe Ratio or Sortino Ratio, inception date, incoming cash flows in past 3-months and year-to-date. From this analysis it will be apparent which ETFs have the most desirable characteristics and offer the most opportunity for the best future returns, although the future is unknowable..
Technical Analysis and Market Timing Review
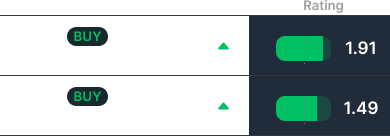
Once you have selected a handful of ETFs from your research, the next step is to determine the technical picture of the ETF coupled with the market trend. Put the ETF ticker symbols in the VectorVest charting tool with a 40-dma, MACD, volume, and Relative Timing (RT) indicator and compare them all. A few will most likely appeal to you, as having the best-looking chart patterns (e.g., price moving upwards towards the right). Then go to the ETF Viewer, type in the tickers and view VectorVest’s rating. If they have a “BUY” rating, and the Daily Color Guard also indicates a “BUY” rating then those ETFs can be purchased, placed in a portfolio, and monitored. Using stop LIMIT orders would also be a wise defensive move to protect your capital if the market reverses.
Want These Types of Insights at Your Fingertips so You Can Win More Trades?
Use VectorVest to Analyze any stock free. VectorVest is the only stock analysis tool and portfolio management system that analyzes, ranks and graphs over 18,000 stocks each day for value, safety, and timing and gives a clear buy, sell or hold rating on every stock, every day.
Before you invest, check VectorVest! Click here to ANALYZE ANY STOCK FREE and see our system in action!
What you should do next…
- Get our latest blogs delivered right to your inbox, subscribe to our newsletter.
- The market moves fast! Get our most current evaluation of this stock with our FREE stock analysis tool.
- Looking for stock picks? Not sure if now is the right time to buy/sell? For a limited time, enjoy the full benefits of a 30-day subscription to VectorVest for only [offer_txt] (usually up to [saving_txt]/month) . Get access to our full list of screeners showcasing our top stock picks that tell you exactly what to buy, when to buy, and when to sell.


