For many of us, deciding when to buy stocks can feel akin to attempting to predict the future or unravel a cryptic code. Sometimes it feels like you need a crystal ball to truly make sense of the markets.
The last thing you want is to buy in too early – and get stuck riding a downtrend rather than an uptrend. Or, to buy in too late – and miss the window for profits, scrounging up a measly few percentage points. Unfortunately, this is the reality for many investors – new and seasoned alike.
But what if we told you that it doesn’t have to be that way? What if we could equip you with an insider’s understanding and a tool that tells you not just what to buy – but when to buy it, and even when to sell it?
In this article, we will demystify the concept of market timing as we assess its impact on your investment returns. You’ll also gain insights into the risks of ill-timed market entry and key indicators that could guide you on your journey of uncovering the right time to buy stocks.
And most importantly, we will introduce you to the best stock analysis app to have in your arsenal for eliminating guesswork and emotion from your trading strategy. With VectorVest, you never need to stress about how to know when to buy stocks again.
From understanding the subtleties of technical indicators and fundamental analysis to reading market trends and volume signals, you’re about to navigate the stock market landscape like never before. By the time we finish this guide, you’ll have a renewed sense of confidence in locating your entry point for every trade. That being said, let’s start by unpacking why timing your entry is so important in the first place.
The Importance of Figuring Out When to Buy Stocks at the Right Time
For some, the importance of figuring out when to buy stocks at the right time is obvious. But if you’re just learning swing trading or learning options trading, you may not yet recognize the role of timing. So, let’s set the stage by talking about how your entry can impact your returns and risk in every trade you make.
Impact of Timing on Returns
Timing in the stock market is everything. It’s the crucial difference between profitable trading or getting stuck cutting losses. It’s the factor that separates the most successful swing traders from those who are left shaking their heads in disbelief. You see, the specific price point at which you buy a stock can significantly impact your returns.
Imagine buying a stock just before its price starts to plummet. The result? You’re left nursing losses, waiting and hoping for the price to climb back up. Every investor’s worst nightmare is buying right before a negative price reversal.
On the other hand, buying a stock just before its price starts to rise can lead to significant profits. It should go without saying that this is your goal with every trade you make. You get to ride the wave of upward momentum, potentially making money as the stock’s price increases.
In simple terms, buy a stock at the right time, and you stand to make a tidy profit. Buy at the wrong time, and you could face losses. But that’s not all. Let’s assess some of the other risks of buying at the wrong time.
Risks of Buying at the Wrong Time
The risk of buying a stock at the wrong time isn’t just about losing money on a single investment. There are other, often overlooked consequences too.
When you buy a stock at its peak, you risk tying up your money in an investment that might take a long time to become profitable. This could mean missing out on other potentially lucrative investment opportunities because your money is stuck in a stock that’s underperforming.
And let’s not forget about the emotional toll. The stress and anxiety of watching a stock you’ve invested in lose value can be intense. Not only can this lead to poor decision-making, such as selling the stock at a loss out of fear, but it can also take the fun out of investing.
That’s why understanding when to buy stocks is so crucial. The good news? It’s actually a lot easier than most people make it out to be. With the right knowledge and tools, you can better time your stock purchases, potentially boosting your returns and reducing your risk.
That being said, let’s get started with some traditional methods of finding your entry point. Then, we’ll introduce you to a simpler, more foolproof method in VectorVest – stay tuned for that.
How to Know When to Buy Stocks: Key Indicators to Aid in Finding Your Entry
Let’s make one thing clear – while you may have come here wondering the best time of day to buy stocks, know that there’s no one size fits all answer. This is also true of the best day of the week to sell stock.
It really comes down to a stock-by-stock basis. So, we’re going to focus our conversation on how you can use analysis and research to figure out when to buy a certain stock.
That being said, this is a lot easier said than done. Many factors influence the best time to buy a stock, from market trends to global economic news. The complexity of these factors often leaves even experienced investors scratching their heads in uncertainty.
Luckily, you can narrow down the optimal entry points using a few key indicators, which include technical indicators, fundamental analysis, market trends, and volume analysis. Let’s break down each of these.
Understanding Technical Indicators & Fundamental Analysis
Technical analysis involves studying past market data to predict future price trends, while fundamental analysis involves evaluating a company’s intrinsic value. Both play a crucial role in determining the best time to buy a stock.
Technical indicators, such as moving averages, relative strength index (RSI), and Bollinger Bands, can provide insights into a stock’s momentum, volatility, and trend strength. These indicators can give signals about potential reversals or breakouts, helping you time your entry points.
On the other hand, the fundamental analysis includes evaluating factors such as the company’s EPS, balance sheet, cash flow, and market position. By analyzing these elements, you can identify undervalued stocks or stocks with strong growth potential. While this doesn’t provide an exact entry point, it can help you shortlist stocks that are worth a closer look.
You can learn more about the best indicators for swing trading in our blog – but with VectorVest, you really don’t even need to bother with these. The system saves you time and frees you from the shackles of complex, convoluted technical analysis. For now, though, let’s talk about trends and charts.
Market Trends and the Importance of Chart Analysis
While technical and fundamental analysis play a crucial role, you also need to understand the larger market trends. Bullish trends (upward-moving markets) often present buying opportunities, while bearish trends (downward-moving markets) might signal that it’s time to hold off on buying.
Chart analysis comes into play here, allowing you to visualize market trends and stock price movements over time. Swing trading patterns such as ‘head and shoulders’, ‘cup and handle’, and ‘double top’ can provide hints about future price direction.
However, reading these patterns and understanding their implications requires expertise and constant learning, which can be time-consuming and complex. Fortunately, VectorVest offers insights into the stock market’s sentiment at any given time with an intuitive market sentiment indicator. On any given day, you can see exactly how the market is feeling/behaving at a glance.
Role of Volume in Determining Buying Signals
Volume, the number of shares traded during a specific period, is a critical yet often overlooked indicator. High volume often implies strong investor interest and can validate a trend.
For example, an upward price movement on high volume indicates strong buying pressure, which could signal the start of an upward trend. Conversely, a price increase on low volume may lack the necessary momentum and could indicate a weak trend.
Volume can also be combined with other indicators to confirm signals. For instance, if a stock breaks above a resistance level on high volume, it’s a stronger signal than if the same move occurred on low volume.
While these traditional methods can help find potential entry points, they are complex, require significant time investment, and are prone to human error. They also rely on the investor’s ability to interpret and react to changes promptly, often leading to decision paralysis or impulsive, emotion-driven choices.
That being said, wouldn’t it be better if you could figure out how to know when to buy stocks with less time, a higher success rate, and lower stress levels? You can…
Introducing a Better Way to Know When to Buy Stocks For Beginners and Experts Alike: VectorVest
You can take our advice and learn more about what affects stock prices and how to analyze a stock using traditional methods. Or, you can save yourself the hassle and headaches and bring yourself into the future of investing: with VectorVest’s stock analysis software. Let’s delve into how the system revolutionizes the way you identify your entry point in stock trading.
Uncover Winning Opportunities on Autopilot
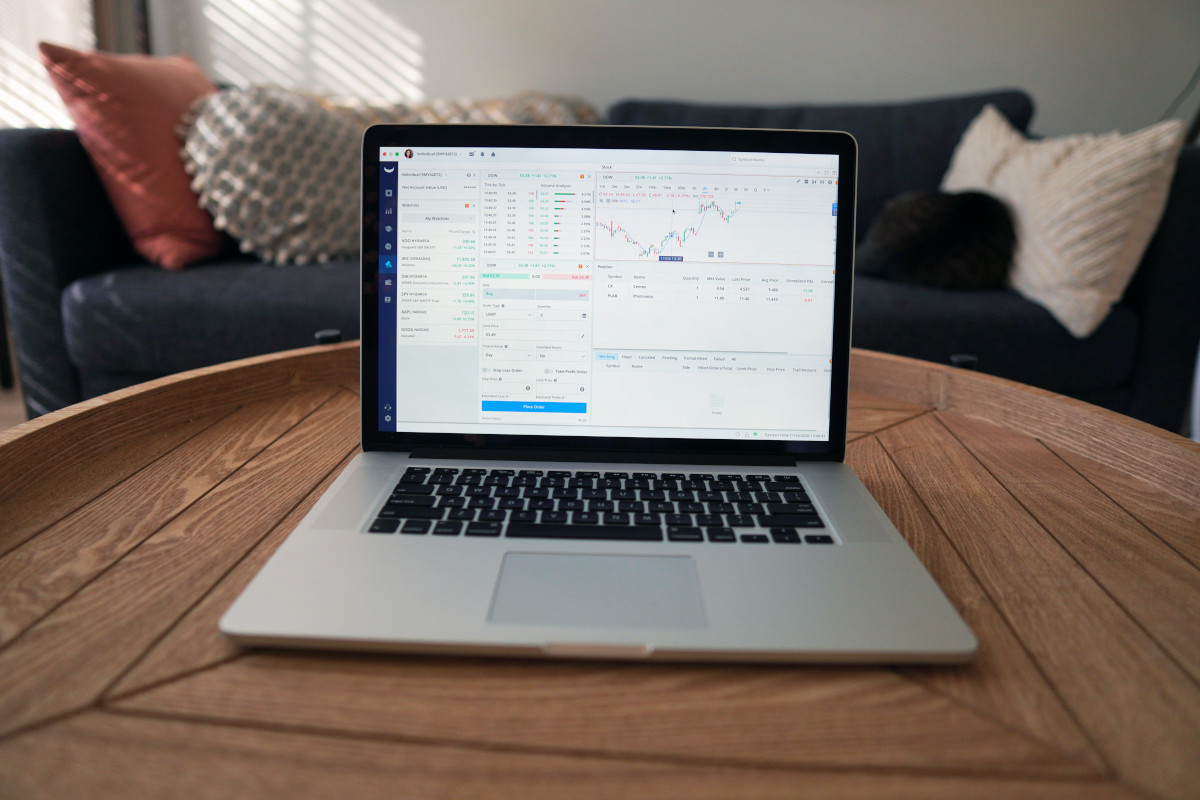
VectorVest automates the process of stock selection by offering real-time market analysis and proprietary indicators. Its algorithms examine over 16,000 stocks every day, helping you spot potential opportunities without the headache of manual analysis.
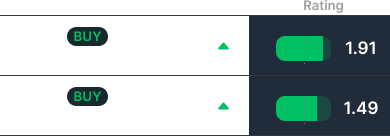
The software ranks each stock based on Value, Safety, and Timing (VST), with a particular emphasis on Timing – an essential aspect when deciding when to buy. Each of these ratings sits on a simple scale of 0.00-2.00, making interpretation quick and easy. Just pick undervalued stocks that are appreciating in price and win more trades.
Whether you’re trying to uncover swing trading stock opportunities or you are searching for the best stock for option trading, the system brings the best candidates on any given day right to your screen. You can rely on our pre-curated stock screeners to consistently find your next trade.
And, helping you pick stocks is just the tip of the iceberg with VectorVest. You came here to learn how to know when to buy stocks – so let’s talk about how the system comes into play.
Time Your Entry to Perfection Through a Proprietary Stock Rating System
As we just mentioned, VectorVest’s proprietary Relative Timing (RT) system provides a score on a scale of 0.00 to 2.00 for each stock, indicating its likely price direction. In the case of the RT rating specifically, though, a score above 1.00 implies an upward price movement, while a score below 1 suggests a potential downtrend.
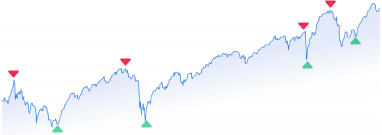
That makes it incredibly valuable as a means of identifying your entry point – which is why it’s considered the best market timing indicator. By utilizing this scoring system, you can pinpoint stocks with positive momentum and time your entry when the RT score begins to rise. It’s like having your personal advisor who uses advanced algorithms to guide you on when to pull the trigger.
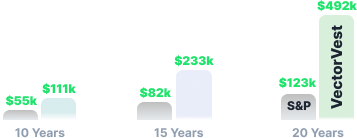
Except here, There is no human error or emotion whatsoever. Just a tried and true system that has outperformed the S&P 500 by 10x for more than two decades. And the system costs a fraction of the price of your potential returns – which is why you don’t need a financial advisor ever again!
But wait – we haven’t even talked about the way in which VectorVest can help manage your position and find your entry point as well…
Manage Your Position Without the Guesswork or Emotion for Effortless Profits
Once you’re invested, VectorVest doesn’t leave you guessing. It provides ongoing guidance on whether to hold, buy more, or sell your positions based on real-time market trends and individual stock performance. This approach eliminates the guesswork, allowing you to manage your portfolio without emotional bias or panic-induced decisions.
You can take things a step further with ProfitLockerPro, our product that manages your exit for you through dynamic trading stops. This helps you lock in profits and cut losses when necessary – ensuring that you never fall victim to human error, guesswork, or emotion again.
Final Thoughts on When to Buy Stocks For Beginners
The complexities of how to know when to buy stocks can leave you overwhelmed – and cost you capital, too. Hopefully, this guide has left you feeling a lot more confident in finding your entry going forward. With VectorVest, you have a powerful tool that simplifies these complexities, providing clear guidance on finding your entry in stocks.
Instead of spending hours on end trying to interpret charts or being swayed by emotional biases, trust VectorVest to offer an optimized, data-driven approach. Make the most of your investment journey and take the guesswork out of knowing the right time to buy stocks.
If you want to learn more about when to take profits on stocks or when to exercise stock options, explore our blog. We have more resources on swing trading for beginners and investing in general. Learn about trading with a small account, how to buy the dip, position trading, how to trade stock options, or the best retirement asset allocation.
Otherwise, it’s time to bring this conversation to a close. Take the first step towards confident, profitable investing by trying VectorVest today!
What you should do next…
- Get our latest blogs delivered right to your inbox, subscribe to our newsletter.
- The market moves fast! Get our most current evaluation of this stock with our FREE stock analysis tool.
- Looking for stock picks? Not sure if now is the right time to buy/sell? For a limited time, enjoy the full benefits of a 30-day subscription to VectorVest for only [offer_txt] (usually up to [saving_txt]/month) . Get access to our full list of screeners showcasing our top stock picks that tell you exactly what to buy, when to buy, and when to sell.


