Protect and grow your stock portfolio in only 10 minutes a day
VectorVest tells you When to Buy · What to Buy · When to Sell.
We analyze 16,000+ stocks daily and give you a simple Buy, Sell, or Hold rating on each—so anyone can make consistent, emotion-free profits.
For a limited time, try VectorVest for only $0.99.
Instant access. Cancel anytime.
NASDAQ Powered Data. VectorVest Trusted Results.
Celebrating 36 years and the trust of over 1 million investors, VectorVest is proud to announce a landmark partnership with Nasdaq! This collaboration brings real-time Nasdaq data directly to our platform, fueling our industry-leading analysis with even greater precision.
What does this mean for you?
More accurate price quotes translate to sharper insights from VectorVest’s core algorithms.
More timely entry and exit points, along with pinpointed market timing calls.
Faster stops within VectorVest’s advanced trading stop signals.
Gain an edge in the tech-heavy Nasdaq – a market known for its fast pace and frequent trading. With VectorVest’s enhanced accuracy, you can navigate it with confidence.
Unlock the power of real-time data

“I originally got this app as a “2nd opinion” brokerage app to determine if Robinhood’s stock ratings were viable or not.”I’ve made +27% in the past 4 months.
App Store Review
I have been using VestorVest for a number of years and am averaging 30% annual returns. VectorVest is instrumental in my success.
App Store Review
I’ve been with VectorVest +10 years and took their course that covers Spread Trading. The next 12 months I pocketed over $110,000 trading SPX only while risking only $20K at any one time.
Third-Party Review

The VectorVest Formula for
Smarter Stock Picks with VST™ ratings.
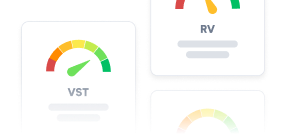
Investing success is built on consistency and reliability—not on chasing fleeting trends. Our proprietary VST™ (Value-Safety-Timing) ratings stack the odds in your favor by identifying safe, undervalued stocks poised for growth—no matter their current popularity.

Value
Undervalued
Lower downside risk & higher growth potential create steady opportunities for gains.

Safety
Financially Stable
Minimize risk by investing in financially stable companies with consistent earnings.

Timing
On the Rise
Capitalize on momentum with stocks already moving in the right direction.
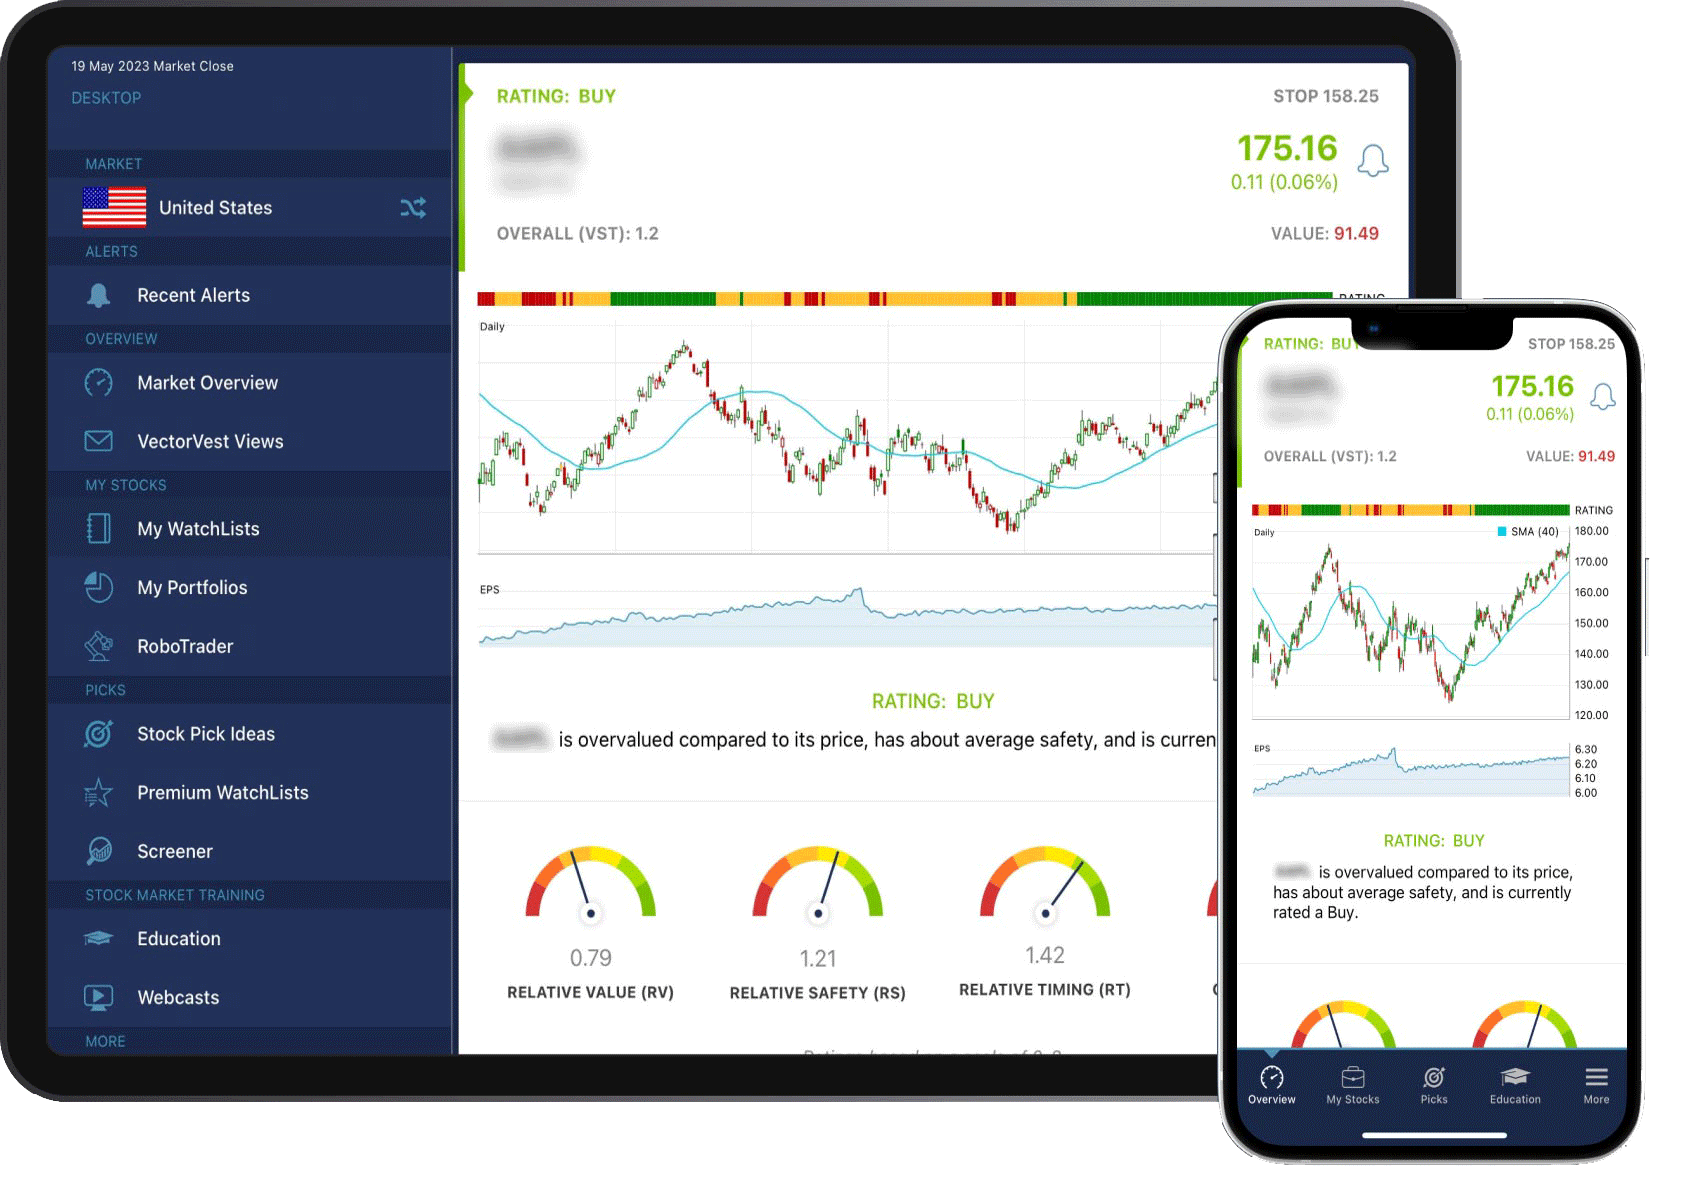
How to Use VST™ Ratings to Manage Your Portfolio in Just 10 Minutes a Day.
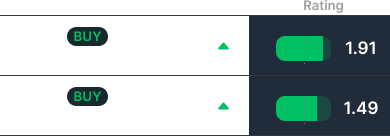
Our exclusive VST™ ratings simplify complex data into actionable buy, sell, or hold recommendations for every stock. This approach makes investing straightforward, even if you’re new to portfolio management or refining your strategy.
- 1
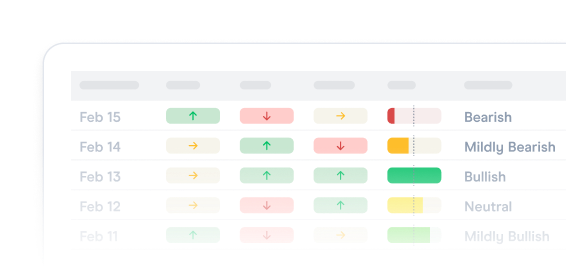
Review the market timing indicator: Check signals to decide whether to buy stocks or secure profits by tightening stops.
- 2
Identify stocks marked as a sell: Ensure you’re exiting positions before stops trigger to minimize losses.
- 3
Pick stocks with top VST ratings: Select high-rated stocks for value, safety, and timing during favorable market conditions.
- 4
Use recommended stop prices: Protect your portfolio with stop-loss prices tailored to each stock’s performance history.
Whether you’re new to investing or a seasoned pro, VectorVest equips you with powerful tools, clear insights, and intuitive learning to help you confidently grow your portfolio and navigate any market condition.
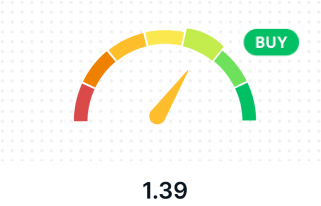
OVERALL
![[NEW] Blog: Widget: Free Stock Analysis](http://qa.vectorvest.com/wp-content/uploads/2025/07/VectorVest-Market-TIming.jpg)
RELATIVE VALUE (RV)
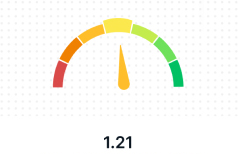
RELATIVE SAFETY (RS)
![[NEW] Blog: Widget: Free Stock Analysis](http://qa.vectorvest.com/wp-content/uploads/2025/07/VectorVest-Market-TIming.jpg)
RELATIVE TIMING (RT)
Navigate Market Swings with Confidence & Capitalize on Every Opportunity
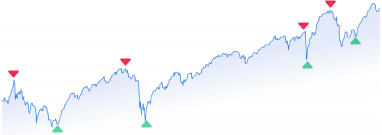
While no one can predict the market, VectorVest’s alerts keep you ahead of the curve. Our system identifies major market shifts, providing precise buy and sell signals to help you dodge downturns and ride rallies for consistent growth.
Mar 20, 2000 – Sell Recommendation
NASDAQ surged 400% in 5 years but crashed 78% from its peak in Oct 2002. VectorVest advised subscribers to exit the market on Mar 20, 2020, securing gains and outperforming buy-and-hold by over 226%.
Mar 17, 2003 – Buy Recommendation
The Dotcom bubble bursting led to a several year bear market. VectorVest made a buy recommendation as momentum shifted and the market rally began.
Nov 2, 2007 – Sell Recommendation
VectorVest advised investors to move to cash on Nov 11, 2007 or to begin shorting the market. Average 19% gains by mid-summer of 2008.
Mar 9, 2009 – Buy Recommendation
VectorVest sees the shift in momentum after the mortgage meltdown and makes a Buy recommendation at the start of one of the longest bull runs in market history.
Feb 21, 2020 – Sell Recommendation
Coronavirus shutdowns erased nearly 11,000 points (roughly 37%) from the DJIA. While nobody could predict the shutdowns to occur VectorVest advised investors to tighten stops and take profits on Feb 21, 2020.
Mar 25, 2020 – Buy Recommendation
VectorVest identified upward momentum and advised investors to buy stocks long, setting subscribers up for one of the fastest market recoveries in history.
Nov 22, 2021 – Sell Recommendation
Record-high inflation and increasing interest rates triggered a stock market decline. VectorVest’s Nov 21, 2021, advice to shift to cash shielded its subscribers from the impact, and those who utilized its shorting tactics made gains of up to 93% in just six months.
Nov 24, 2023 – Buy Recommendation
Cooling inflation and a pause in Fed rate hikes signaled a shift in market sentiment. VectorVest’s Nov 24, 2023, buy signal positioned subscribers to ride the rally, with gains driven by renewed tech strength, soft landing hopes, and AI-led optimism.
The world’s most advanced market timing signals, and features designed for all investors.
You can’t predict the market, but our cutting-edge market-timing signals and proprietary VST™ ratings (Value-Safety-Timing) ratings let you capitalize on upswings and steer clear of downturns.

Advanced Market Timing
Buy and sell at the right time with our advanced market-timing algorithm.

Buy, Sell & Hold Signals
Clear buy, sell and hold signals that tell you exactly what stocks to buy, what to sell and when.

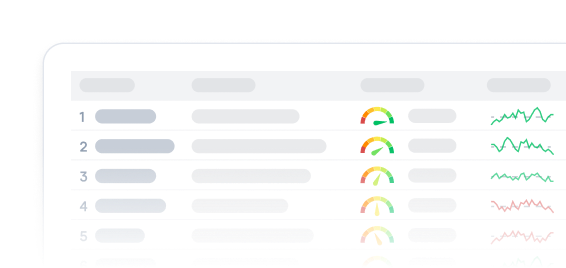
Daily Stock Picks
Plus explore VST™ ranked stocks in a variety of sectors with our pre-built screeners.

Fundamental & Technical Analysis
Combines technical and fundamental analysis, distilled down to an easy-to-understand VST™ rating.

Proven Performance
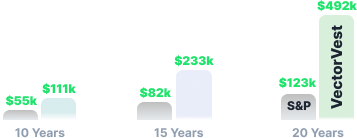
We’ve outperformed the S&P 500 by over 2000% for 20+ years. Verify every call we’ve made directly in our platform.

Preserve Your Wealth
Our VST™ ratings and recommended stop prices help you avoid losses and preserve your profits.

Suits All Market Conditions
Our market timing indicators help you navigate volatile market conditions, and avoid or short downturns.

All Investing Strategies
Ideal for long-term traders, those in or near retirement, as well as short-term and day traders.

New & Seasoned Investors
Ideal for novice investors, but with limitless opportunities for seasoned investors or those developing their skills.
+1,071%
Consistently Beating the Market: 15% Average Annual Returns for Nearly Two-Decades
VectorVest has outperformed the S&P 500 and major stock indices for over 16 years. Don’t just take our word—explore every call we’ve made and the results during your trial, giving you full transparency and confidence in our system.
Rated 4.7 stars from 15,000+ independently published reviews.
“I originally got this app as a “2nd opinion” brokerage app to determine if Robinhood’s stock ratings were viable or not.”I’ve made +27% in the past 4 months.
I have been using VestorVest for a number of years and am averaging 30% annual returns. VectorVest is instrumental in my success.
I’ve been with VectorVest +10 years and took their course that covers Spread Trading. The next 12 months I pocketed over $110,000 trading SPX only while risking only $20K at any one time.
Excellent set of tools… I consistently beat all my professionally managed accounts. Really can’t imagine not having them part of my daily routine.
Using the VectorVest tools I made over $32,000 in less than two weeks on one trade. Subscribing to VectorVest is the smartest investment decision that I have made.
With this tool I can check any stock and make the right call most of the time. It has simplified things for me. My portfolio is going gang busters.
The VectorVest Engine
The VectorVest Engine™ analyzes 16,000+ stocks every day and gives a simple buy, sell, or hold rating on each. This guidance reliably guides you on when to buy low and sell high.
Frequently Asked Questions


