VectorVest Newsletter
What is Lorem Ipsum?
Lorem ipsum dolor sit amet, consectetur adipiscing elit, sed do eiusmod tempor incididunt ut labore et dolore magna aliqua. Ut enim ad minim veniam, quis nostrud exercitation ullamco laboris nisi ut aliquip ex ea commodo consequat. Duis aute irure dolor in reprehenderit in voluptate velit esse cillum dolore eu fugiat nulla pariatur. Excepteur sint occaecat cupidatat non proident, sunt in culpa qui officia deserunt mollit anim id est laborum.
VectorVest is a simple source for market guidance
that helps you make money in the stock market.
VectorVest is the only stock analysis and portfolio management system that analyzes, ranks and graphs over 16,500 stocks each day for value, safety and timing and gives a clear buy, sell or hold rating on every stock every day.
VectorVest gives you ANSWERS, not just data. What to buy. What to sell. Most importantly, WHEN. Unbiased, independent answers. Investment guidance provided at a glance or through your own analysis.
How can something so complicated be that simple?
For over 40 years, VectorVest has been creating mathematical models to clearly define EXACTLY what causes a stock’s price to rise or fall. No opinions or guesswork. Just math.
It can all be summed up in three mathematical models: value, safety and timing (VST). VectorVest rates Value, Safety and Timing the same: it starts at 1.00, and ranges from 0.00 To 2.00.
READ MORE
Take Relative Value (RV): Anything above 1.00 is worth looking at. Anything below 1.00 is a red flag. Stocks with ratings higher than 1.00 have above average appreciation potential. If it were below average, you’d be better off in AAA corporate bonds.
Relative Safety (RS): Tells you how stable a stock is compared to other investments. Again, if the stock is above 1.00, it’s safer and more predictable than other stocks. If it’s risky and unpredictable, the rating will be below 1.00.
Finally, Relative Timing (RT): How does the short-term price performance look? Above 1.00 is good, below 1.00 is risky, and if the price trend is flat, it just gets a 1.00.
The result is a system for stock market trend analysis using value, safety and timing (VST) to create clear BUY, SELL and HOLD signals that direct investors to rising stocks, in rising sectors and markets. No guesswork. No gut feelings.
Deciding is simple. Choose the stock with the highest VST.
Discover World-Class
Stock Analysis & Market Guidance
VectorVest tells you when to buy, what to buy,
and when to sell. It’s that simple.
- What stocks should you buy?
- Is now a good time to buy?
- When should you consider taking profits?
Direct & definitive answers at a glance or through your own analysis of VectorVest’s powerful database and charting tools.
100% satisfaction guarantee or your money back.
What Subscribers are Saying
Bull & Bear Market Beating Returns
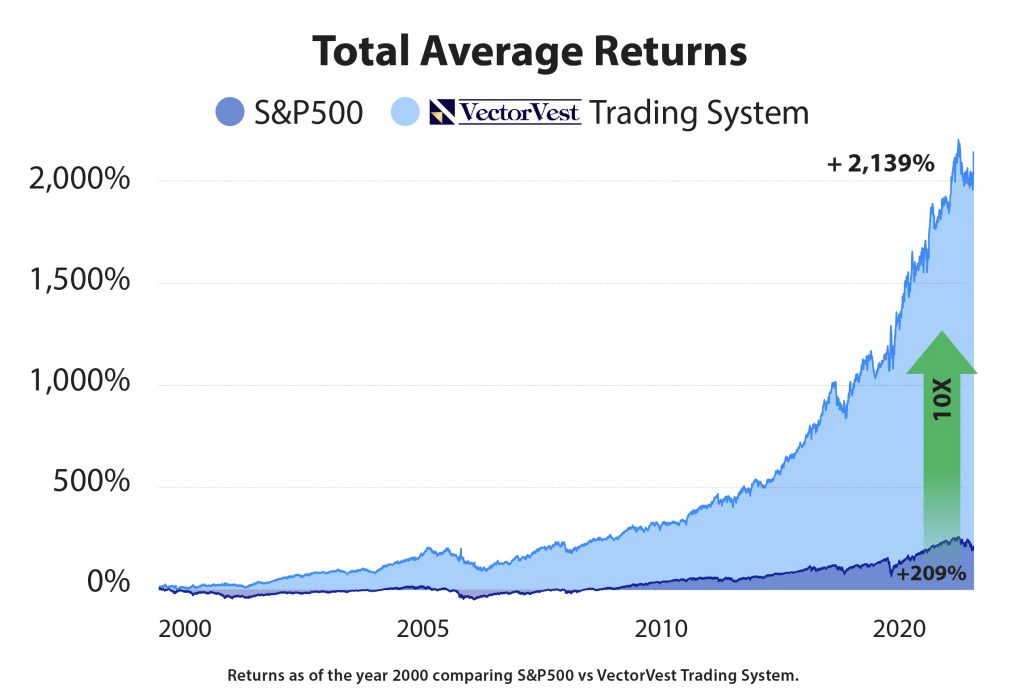
VectorVest has outperformed
the S&P 500 by 10x over 22 years!
How have we accomplished such an impressive feat? Simple. While others are buying and holding, we believe different markets require different investment strategies. During bull runs we recommend stocks with consistent and predictable earnings growth. During bear markets we advocate moving to cash or taking short positions.
Best part is we tell you when and how to do it all!
It’s easier than you think.
VectorVest is the only service that gives you information going back to 1995, so you can test and verify its amazing performance.